Cypriot vs Immigrants from Bosnia and Herzegovina 6th Grade
COMPARE
Cypriot
Immigrants from Bosnia and Herzegovina
6th Grade
6th Grade Comparison
Cypriots
Immigrants from Bosnia and Herzegovina
97.5%
6TH GRADE
98.7/ 100
METRIC RATING
94th/ 347
METRIC RANK
97.2%
6TH GRADE
74.8/ 100
METRIC RATING
150th/ 347
METRIC RANK
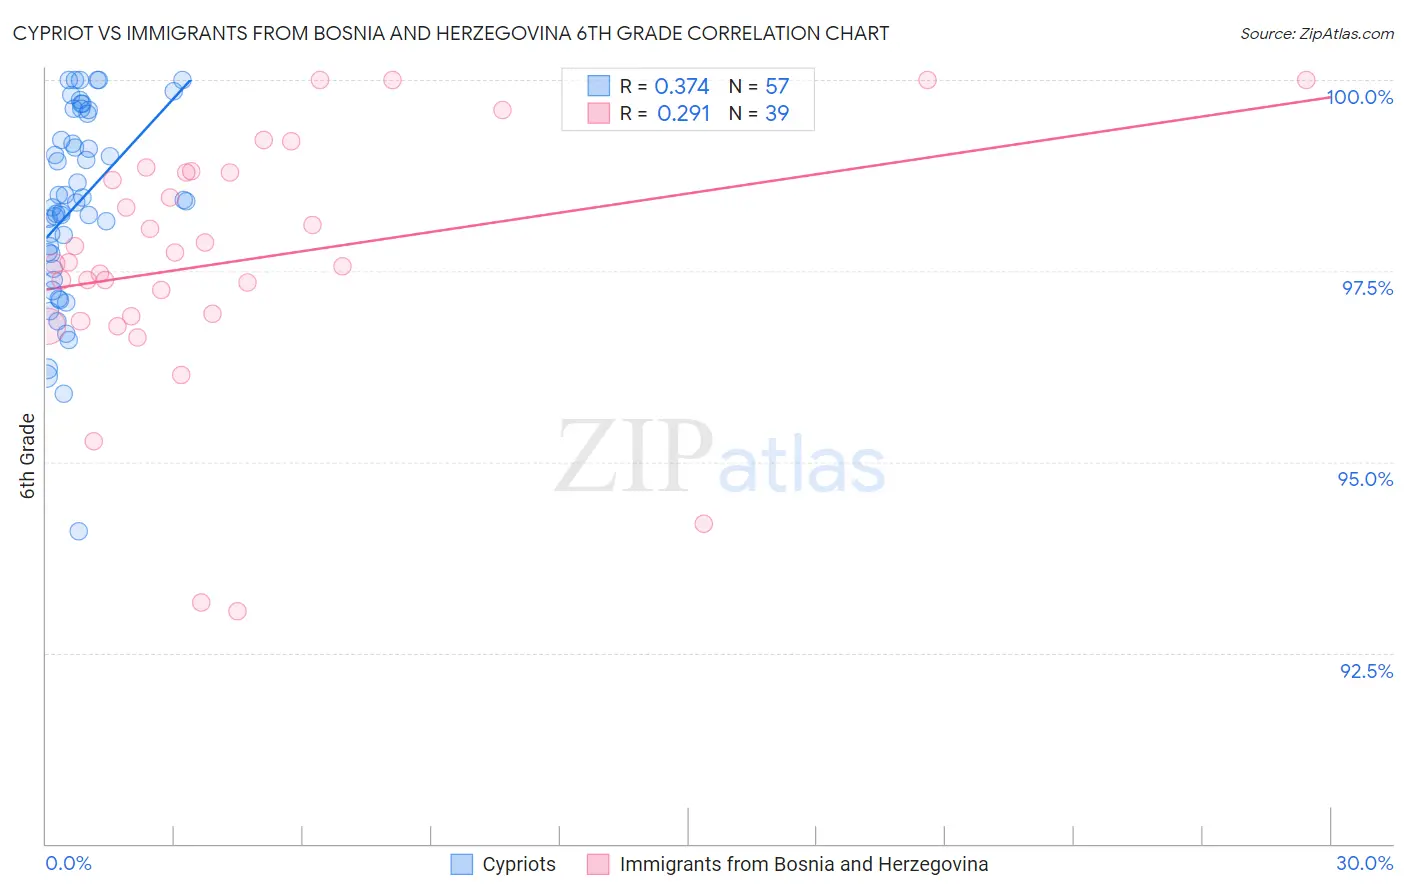
Cypriot vs Immigrants from Bosnia and Herzegovina 6th Grade Correlation Chart
The statistical analysis conducted on geographies consisting of 61,870,289 people shows a mild positive correlation between the proportion of Cypriots and percentage of population with at least 6th grade education in the United States with a correlation coefficient (R) of 0.374 and weighted average of 97.5%. Similarly, the statistical analysis conducted on geographies consisting of 156,779,463 people shows a weak positive correlation between the proportion of Immigrants from Bosnia and Herzegovina and percentage of population with at least 6th grade education in the United States with a correlation coefficient (R) of 0.291 and weighted average of 97.2%, a difference of 0.37%.
6th Grade Correlation Summary
| Measurement | Cypriot | Immigrants from Bosnia and Herzegovina |
| Minimum | 94.1% | 93.0% |
| Maximum | 100.0% | 100.0% |
| Range | 5.9% | 7.0% |
| Mean | 98.4% | 97.6% |
| Median | 98.4% | 97.6% |
| Interquartile 25% (IQ1) | 97.6% | 96.9% |
| Interquartile 75% (IQ3) | 99.6% | 98.8% |
| Interquartile Range (IQR) | 2.0% | 1.9% |
| Standard Deviation (Sample) | 1.3% | 1.7% |
| Standard Deviation (Population) | 1.3% | 1.6% |
Similar Demographics by 6th Grade
Demographics Similar to Cypriots by 6th Grade
In terms of 6th grade, the demographic groups most similar to Cypriots are Romanian (97.5%, a difference of 0.0%), Cree (97.5%, a difference of 0.0%), Immigrants from Ireland (97.5%, a difference of 0.0%), Immigrants from Germany (97.5%, a difference of 0.0%), and Immigrants from Sweden (97.5%, a difference of 0.0%).
| Demographics | Rating | Rank | 6th Grade |
| Puget Sound Salish | 98.9 /100 | #87 | Exceptional 97.5% |
| Immigrants | South Africa | 98.9 /100 | #88 | Exceptional 97.5% |
| Immigrants | Australia | 98.8 /100 | #89 | Exceptional 97.5% |
| Pueblo | 98.8 /100 | #90 | Exceptional 97.5% |
| Immigrants | Western Europe | 98.8 /100 | #91 | Exceptional 97.5% |
| Romanians | 98.7 /100 | #92 | Exceptional 97.5% |
| Cree | 98.7 /100 | #93 | Exceptional 97.5% |
| Cypriots | 98.7 /100 | #94 | Exceptional 97.5% |
| Immigrants | Ireland | 98.7 /100 | #95 | Exceptional 97.5% |
| Immigrants | Germany | 98.6 /100 | #96 | Exceptional 97.5% |
| Immigrants | Sweden | 98.6 /100 | #97 | Exceptional 97.5% |
| Immigrants | Denmark | 98.5 /100 | #98 | Exceptional 97.5% |
| Yugoslavians | 98.5 /100 | #99 | Exceptional 97.5% |
| Turks | 98.3 /100 | #100 | Exceptional 97.5% |
| South Africans | 98.2 /100 | #101 | Exceptional 97.5% |
Demographics Similar to Immigrants from Bosnia and Herzegovina by 6th Grade
In terms of 6th grade, the demographic groups most similar to Immigrants from Bosnia and Herzegovina are French American Indian (97.2%, a difference of 0.0%), Immigrants from Israel (97.2%, a difference of 0.010%), Immigrants from Jordan (97.2%, a difference of 0.010%), Immigrants from Eastern Europe (97.2%, a difference of 0.010%), and Immigrants from South Central Asia (97.2%, a difference of 0.020%).
| Demographics | Rating | Rank | 6th Grade |
| Pima | 82.9 /100 | #143 | Excellent 97.2% |
| Israelis | 82.9 /100 | #144 | Excellent 97.2% |
| Spaniards | 80.1 /100 | #145 | Excellent 97.2% |
| Hopi | 78.8 /100 | #146 | Good 97.2% |
| Immigrants | South Central Asia | 78.1 /100 | #147 | Good 97.2% |
| Immigrants | Greece | 77.8 /100 | #148 | Good 97.2% |
| Immigrants | Israel | 76.0 /100 | #149 | Good 97.2% |
| Immigrants | Bosnia and Herzegovina | 74.8 /100 | #150 | Good 97.2% |
| French American Indians | 74.0 /100 | #151 | Good 97.2% |
| Immigrants | Jordan | 73.0 /100 | #152 | Good 97.2% |
| Immigrants | Eastern Europe | 72.6 /100 | #153 | Good 97.2% |
| Soviet Union | 71.5 /100 | #154 | Good 97.2% |
| Ute | 71.1 /100 | #155 | Good 97.1% |
| Alsatians | 69.8 /100 | #156 | Good 97.1% |
| Immigrants | Russia | 67.6 /100 | #157 | Good 97.1% |