Croatian vs Immigrants from China Nursery School
COMPARE
Croatian
Immigrants from China
Nursery School
Nursery School Comparison
Croatians
Immigrants from China
98.6%
NURSERY SCHOOL
100.0/ 100
METRIC RATING
28th/ 347
METRIC RANK
97.5%
NURSERY SCHOOL
0.1/ 100
METRIC RATING
273rd/ 347
METRIC RANK
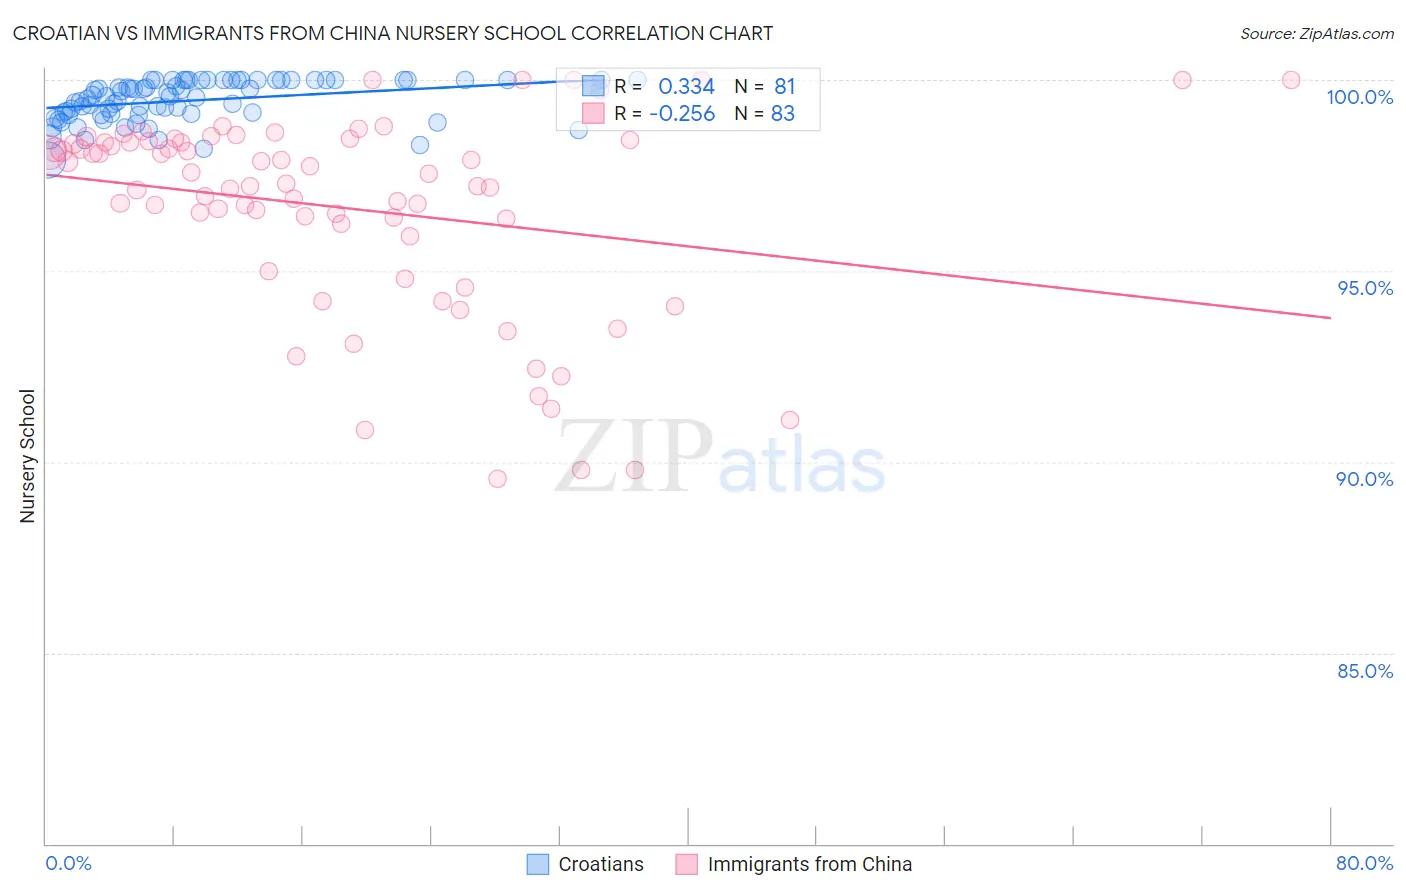
Croatian vs Immigrants from China Nursery School Correlation Chart
The statistical analysis conducted on geographies consisting of 375,731,938 people shows a mild positive correlation between the proportion of Croatians and percentage of population with at least nursery school education in the United States with a correlation coefficient (R) of 0.334 and weighted average of 98.6%. Similarly, the statistical analysis conducted on geographies consisting of 457,082,957 people shows a weak negative correlation between the proportion of Immigrants from China and percentage of population with at least nursery school education in the United States with a correlation coefficient (R) of -0.256 and weighted average of 97.5%, a difference of 1.2%.
Nursery School Correlation Summary
| Measurement | Croatian | Immigrants from China |
| Minimum | 97.9% | 89.6% |
| Maximum | 100.0% | 100.0% |
| Range | 2.1% | 10.4% |
| Mean | 99.5% | 96.6% |
| Median | 99.6% | 97.3% |
| Interquartile 25% (IQ1) | 99.1% | 95.9% |
| Interquartile 75% (IQ3) | 100.0% | 98.4% |
| Interquartile Range (IQR) | 0.90% | 2.5% |
| Standard Deviation (Sample) | 0.53% | 2.6% |
| Standard Deviation (Population) | 0.53% | 2.6% |
Similar Demographics by Nursery School
Demographics Similar to Croatians by Nursery School
In terms of nursery school, the demographic groups most similar to Croatians are Sioux (98.6%, a difference of 0.010%), Arapaho (98.6%, a difference of 0.010%), French (98.6%, a difference of 0.010%), European (98.6%, a difference of 0.010%), and Finnish (98.6%, a difference of 0.020%).
| Demographics | Rating | Rank | Nursery School |
| Finns | 100.0 /100 | #21 | Exceptional 98.6% |
| Lithuanians | 100.0 /100 | #22 | Exceptional 98.6% |
| Poles | 100.0 /100 | #23 | Exceptional 98.6% |
| Danes | 100.0 /100 | #24 | Exceptional 98.6% |
| Scotch-Irish | 100.0 /100 | #25 | Exceptional 98.6% |
| Sioux | 100.0 /100 | #26 | Exceptional 98.6% |
| Arapaho | 100.0 /100 | #27 | Exceptional 98.6% |
| Croatians | 100.0 /100 | #28 | Exceptional 98.6% |
| French | 100.0 /100 | #29 | Exceptional 98.6% |
| Europeans | 100.0 /100 | #30 | Exceptional 98.6% |
| Czechs | 100.0 /100 | #31 | Exceptional 98.6% |
| French Canadians | 100.0 /100 | #32 | Exceptional 98.6% |
| Scandinavians | 100.0 /100 | #33 | Exceptional 98.6% |
| Chinese | 100.0 /100 | #34 | Exceptional 98.6% |
| Swiss | 100.0 /100 | #35 | Exceptional 98.6% |
Demographics Similar to Immigrants from China by Nursery School
In terms of nursery school, the demographic groups most similar to Immigrants from China are Immigrants from Cameroon (97.5%, a difference of 0.0%), Ghanaian (97.5%, a difference of 0.0%), Immigrants from Bolivia (97.5%, a difference of 0.020%), Immigrants from Philippines (97.5%, a difference of 0.020%), and Immigrants from Western Africa (97.4%, a difference of 0.030%).
| Demographics | Rating | Rank | Nursery School |
| Immigrants | Sierra Leone | 0.3 /100 | #266 | Tragic 97.6% |
| Immigrants | Nigeria | 0.3 /100 | #267 | Tragic 97.5% |
| West Indians | 0.3 /100 | #268 | Tragic 97.5% |
| Immigrants | Liberia | 0.3 /100 | #269 | Tragic 97.5% |
| Immigrants | Jamaica | 0.2 /100 | #270 | Tragic 97.5% |
| Immigrants | Peru | 0.2 /100 | #271 | Tragic 97.5% |
| Immigrants | Bolivia | 0.1 /100 | #272 | Tragic 97.5% |
| Immigrants | China | 0.1 /100 | #273 | Tragic 97.5% |
| Immigrants | Cameroon | 0.1 /100 | #274 | Tragic 97.5% |
| Ghanaians | 0.1 /100 | #275 | Tragic 97.5% |
| Immigrants | Philippines | 0.1 /100 | #276 | Tragic 97.5% |
| Immigrants | Western Africa | 0.1 /100 | #277 | Tragic 97.4% |
| Immigrants | Uzbekistan | 0.1 /100 | #278 | Tragic 97.4% |
| Immigrants | Ghana | 0.1 /100 | #279 | Tragic 97.4% |
| Barbadians | 0.0 /100 | #280 | Tragic 97.4% |