Creek vs Salvadoran 1st Grade
COMPARE
Creek
Salvadoran
1st Grade
1st Grade Comparison
Creek
Salvadorans
98.4%
1ST GRADE
99.7/ 100
METRIC RATING
59th/ 347
METRIC RANK
96.3%
1ST GRADE
0.0/ 100
METRIC RATING
343rd/ 347
METRIC RANK
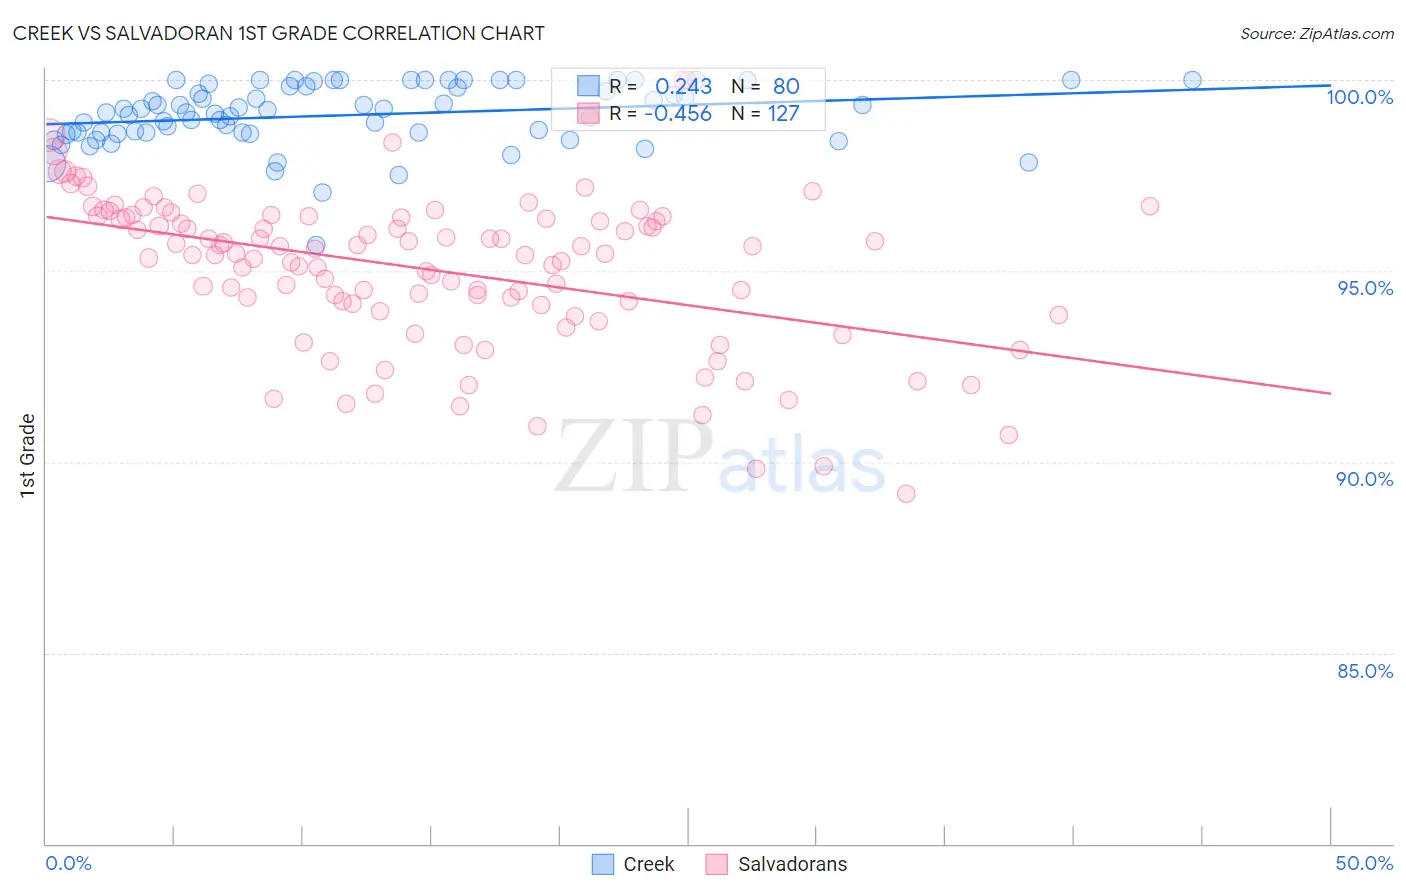
Creek vs Salvadoran 1st Grade Correlation Chart
The statistical analysis conducted on geographies consisting of 178,480,663 people shows a weak positive correlation between the proportion of Creek and percentage of population with at least 1st grade education in the United States with a correlation coefficient (R) of 0.243 and weighted average of 98.4%. Similarly, the statistical analysis conducted on geographies consisting of 398,901,064 people shows a moderate negative correlation between the proportion of Salvadorans and percentage of population with at least 1st grade education in the United States with a correlation coefficient (R) of -0.456 and weighted average of 96.3%, a difference of 2.2%.
1st Grade Correlation Summary
| Measurement | Creek | Salvadoran |
| Minimum | 95.7% | 89.2% |
| Maximum | 100.0% | 100.0% |
| Range | 4.3% | 10.8% |
| Mean | 99.1% | 95.0% |
| Median | 99.2% | 95.4% |
| Interquartile 25% (IQ1) | 98.6% | 94.1% |
| Interquartile 75% (IQ3) | 99.8% | 96.4% |
| Interquartile Range (IQR) | 1.2% | 2.3% |
| Standard Deviation (Sample) | 0.82% | 2.0% |
| Standard Deviation (Population) | 0.81% | 2.0% |
Similar Demographics by 1st Grade
Demographics Similar to Creek by 1st Grade
In terms of 1st grade, the demographic groups most similar to Creek are New Zealander (98.4%, a difference of 0.0%), Immigrants from Canada (98.4%, a difference of 0.0%), Bulgarian (98.4%, a difference of 0.0%), Slavic (98.4%, a difference of 0.0%), and Immigrants from North America (98.4%, a difference of 0.0%).
| Demographics | Rating | Rank | 1st Grade |
| Pueblo | 99.8 /100 | #52 | Exceptional 98.4% |
| Kiowa | 99.8 /100 | #53 | Exceptional 98.4% |
| Australians | 99.8 /100 | #54 | Exceptional 98.4% |
| Immigrants | Scotland | 99.8 /100 | #55 | Exceptional 98.4% |
| Americans | 99.8 /100 | #56 | Exceptional 98.4% |
| Austrians | 99.8 /100 | #57 | Exceptional 98.4% |
| New Zealanders | 99.7 /100 | #58 | Exceptional 98.4% |
| Creek | 99.7 /100 | #59 | Exceptional 98.4% |
| Immigrants | Canada | 99.7 /100 | #60 | Exceptional 98.4% |
| Bulgarians | 99.7 /100 | #61 | Exceptional 98.4% |
| Slavs | 99.7 /100 | #62 | Exceptional 98.4% |
| Immigrants | North America | 99.7 /100 | #63 | Exceptional 98.4% |
| Greeks | 99.7 /100 | #64 | Exceptional 98.4% |
| Maltese | 99.7 /100 | #65 | Exceptional 98.4% |
| Canadians | 99.6 /100 | #66 | Exceptional 98.3% |
Demographics Similar to Salvadorans by 1st Grade
In terms of 1st grade, the demographic groups most similar to Salvadorans are Immigrants from Mexico (96.3%, a difference of 0.030%), Immigrants from Central America (96.3%, a difference of 0.060%), Immigrants from Cabo Verde (96.3%, a difference of 0.080%), Immigrants from Guatemala (96.4%, a difference of 0.10%), and Nepalese (96.1%, a difference of 0.13%).
| Demographics | Rating | Rank | 1st Grade |
| Immigrants | Dominican Republic | 0.0 /100 | #333 | Tragic 96.5% |
| Bangladeshis | 0.0 /100 | #334 | Tragic 96.5% |
| Yakama | 0.0 /100 | #335 | Tragic 96.5% |
| Guatemalans | 0.0 /100 | #336 | Tragic 96.5% |
| Immigrants | Cambodia | 0.0 /100 | #337 | Tragic 96.5% |
| Immigrants | Fiji | 0.0 /100 | #338 | Tragic 96.4% |
| Immigrants | Guatemala | 0.0 /100 | #339 | Tragic 96.4% |
| Immigrants | Cabo Verde | 0.0 /100 | #340 | Tragic 96.3% |
| Immigrants | Central America | 0.0 /100 | #341 | Tragic 96.3% |
| Immigrants | Mexico | 0.0 /100 | #342 | Tragic 96.3% |
| Salvadorans | 0.0 /100 | #343 | Tragic 96.3% |
| Nepalese | 0.0 /100 | #344 | Tragic 96.1% |
| Immigrants | El Salvador | 0.0 /100 | #345 | Tragic 96.1% |
| Immigrants | Yemen | 0.0 /100 | #346 | Tragic 95.8% |
| Spanish American Indians | 0.0 /100 | #347 | Tragic 95.7% |