Ghanaian vs Salvadoran 1st Grade
COMPARE
Ghanaian
Salvadoran
1st Grade
1st Grade Comparison
Ghanaians
Salvadorans
97.4%
1ST GRADE
0.1/ 100
METRIC RATING
274th/ 347
METRIC RANK
96.3%
1ST GRADE
0.0/ 100
METRIC RATING
343rd/ 347
METRIC RANK
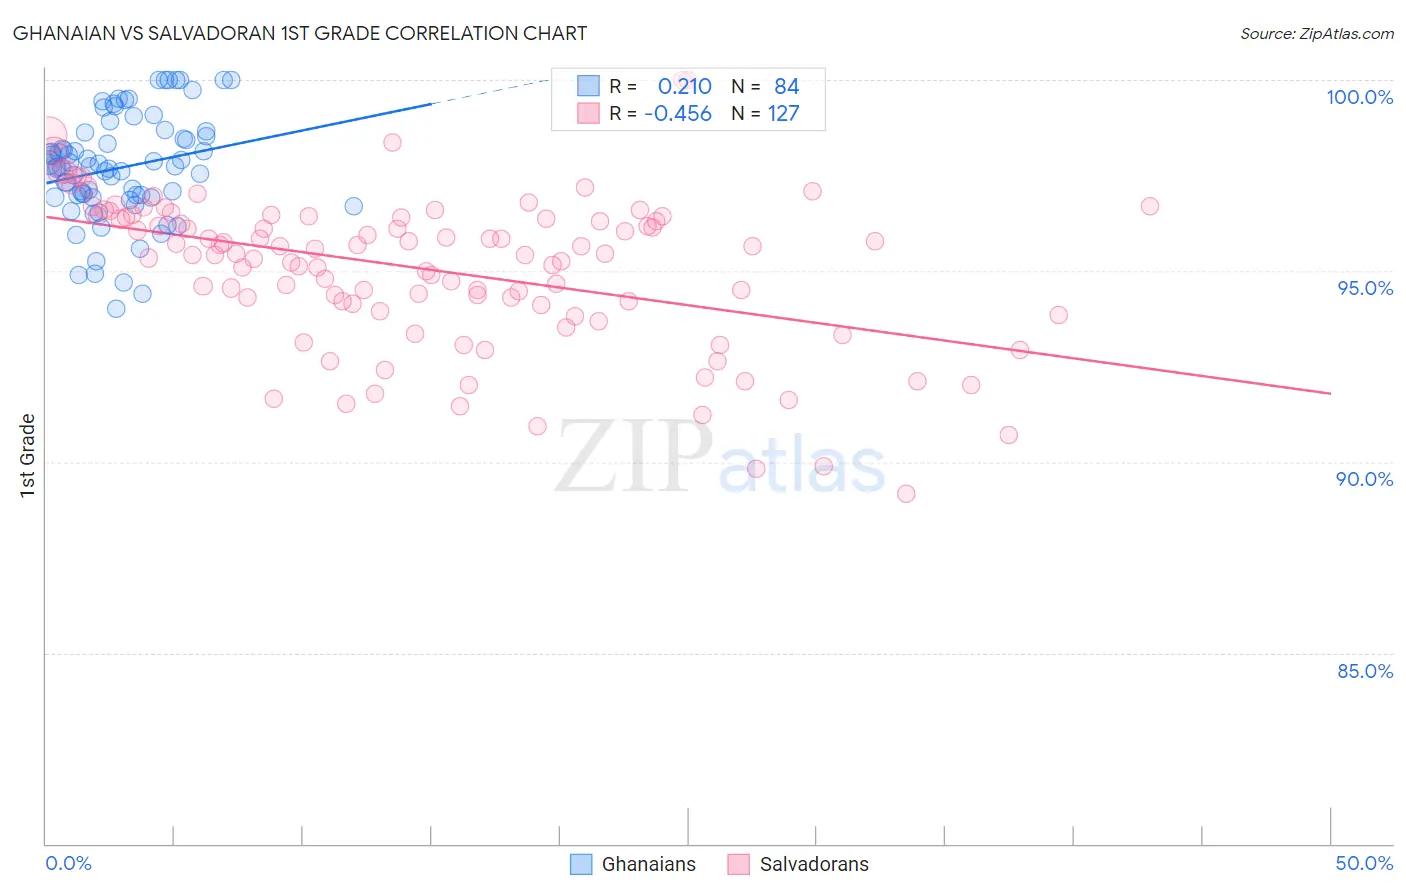
Ghanaian vs Salvadoran 1st Grade Correlation Chart
The statistical analysis conducted on geographies consisting of 190,712,873 people shows a weak positive correlation between the proportion of Ghanaians and percentage of population with at least 1st grade education in the United States with a correlation coefficient (R) of 0.210 and weighted average of 97.4%. Similarly, the statistical analysis conducted on geographies consisting of 398,901,064 people shows a moderate negative correlation between the proportion of Salvadorans and percentage of population with at least 1st grade education in the United States with a correlation coefficient (R) of -0.456 and weighted average of 96.3%, a difference of 1.2%.
1st Grade Correlation Summary
| Measurement | Ghanaian | Salvadoran |
| Minimum | 94.0% | 89.2% |
| Maximum | 100.0% | 100.0% |
| Range | 6.0% | 10.8% |
| Mean | 97.7% | 95.0% |
| Median | 97.7% | 95.4% |
| Interquartile 25% (IQ1) | 97.0% | 94.1% |
| Interquartile 75% (IQ3) | 98.6% | 96.4% |
| Interquartile Range (IQR) | 1.6% | 2.3% |
| Standard Deviation (Sample) | 1.4% | 2.0% |
| Standard Deviation (Population) | 1.4% | 2.0% |
Similar Demographics by 1st Grade
Demographics Similar to Ghanaians by 1st Grade
In terms of 1st grade, the demographic groups most similar to Ghanaians are Immigrants from China (97.4%, a difference of 0.0%), Immigrants from Philippines (97.4%, a difference of 0.020%), Immigrants from Cameroon (97.4%, a difference of 0.030%), Immigrants from Peru (97.4%, a difference of 0.030%), and Immigrants from Bolivia (97.4%, a difference of 0.030%).
| Demographics | Rating | Rank | 1st Grade |
| Immigrants | Sierra Leone | 0.3 /100 | #267 | Tragic 97.5% |
| Immigrants | Nigeria | 0.3 /100 | #268 | Tragic 97.5% |
| West Indians | 0.3 /100 | #269 | Tragic 97.5% |
| Immigrants | Jamaica | 0.2 /100 | #270 | Tragic 97.5% |
| Immigrants | Cameroon | 0.2 /100 | #271 | Tragic 97.4% |
| Immigrants | Peru | 0.2 /100 | #272 | Tragic 97.4% |
| Immigrants | Bolivia | 0.2 /100 | #273 | Tragic 97.4% |
| Ghanaians | 0.1 /100 | #274 | Tragic 97.4% |
| Immigrants | China | 0.1 /100 | #275 | Tragic 97.4% |
| Immigrants | Philippines | 0.1 /100 | #276 | Tragic 97.4% |
| Immigrants | Western Africa | 0.1 /100 | #277 | Tragic 97.4% |
| Immigrants | Uzbekistan | 0.1 /100 | #278 | Tragic 97.4% |
| Immigrants | Ghana | 0.1 /100 | #279 | Tragic 97.4% |
| Afghans | 0.1 /100 | #280 | Tragic 97.4% |
| Trinidadians and Tobagonians | 0.1 /100 | #281 | Tragic 97.3% |
Demographics Similar to Salvadorans by 1st Grade
In terms of 1st grade, the demographic groups most similar to Salvadorans are Immigrants from Mexico (96.3%, a difference of 0.030%), Immigrants from Central America (96.3%, a difference of 0.060%), Immigrants from Cabo Verde (96.3%, a difference of 0.080%), Immigrants from Guatemala (96.4%, a difference of 0.10%), and Nepalese (96.1%, a difference of 0.13%).
| Demographics | Rating | Rank | 1st Grade |
| Immigrants | Dominican Republic | 0.0 /100 | #333 | Tragic 96.5% |
| Bangladeshis | 0.0 /100 | #334 | Tragic 96.5% |
| Yakama | 0.0 /100 | #335 | Tragic 96.5% |
| Guatemalans | 0.0 /100 | #336 | Tragic 96.5% |
| Immigrants | Cambodia | 0.0 /100 | #337 | Tragic 96.5% |
| Immigrants | Fiji | 0.0 /100 | #338 | Tragic 96.4% |
| Immigrants | Guatemala | 0.0 /100 | #339 | Tragic 96.4% |
| Immigrants | Cabo Verde | 0.0 /100 | #340 | Tragic 96.3% |
| Immigrants | Central America | 0.0 /100 | #341 | Tragic 96.3% |
| Immigrants | Mexico | 0.0 /100 | #342 | Tragic 96.3% |
| Salvadorans | 0.0 /100 | #343 | Tragic 96.3% |
| Nepalese | 0.0 /100 | #344 | Tragic 96.1% |
| Immigrants | El Salvador | 0.0 /100 | #345 | Tragic 96.1% |
| Immigrants | Yemen | 0.0 /100 | #346 | Tragic 95.8% |
| Spanish American Indians | 0.0 /100 | #347 | Tragic 95.7% |