Comanche vs Immigrants from Serbia 3rd Grade
COMPARE
Comanche
Immigrants from Serbia
3rd Grade
3rd Grade Comparison
Comanche
Immigrants from Serbia
97.8%
3RD GRADE
53.8/ 100
METRIC RATING
169th/ 347
METRIC RANK
98.0%
3RD GRADE
91.9/ 100
METRIC RATING
129th/ 347
METRIC RANK
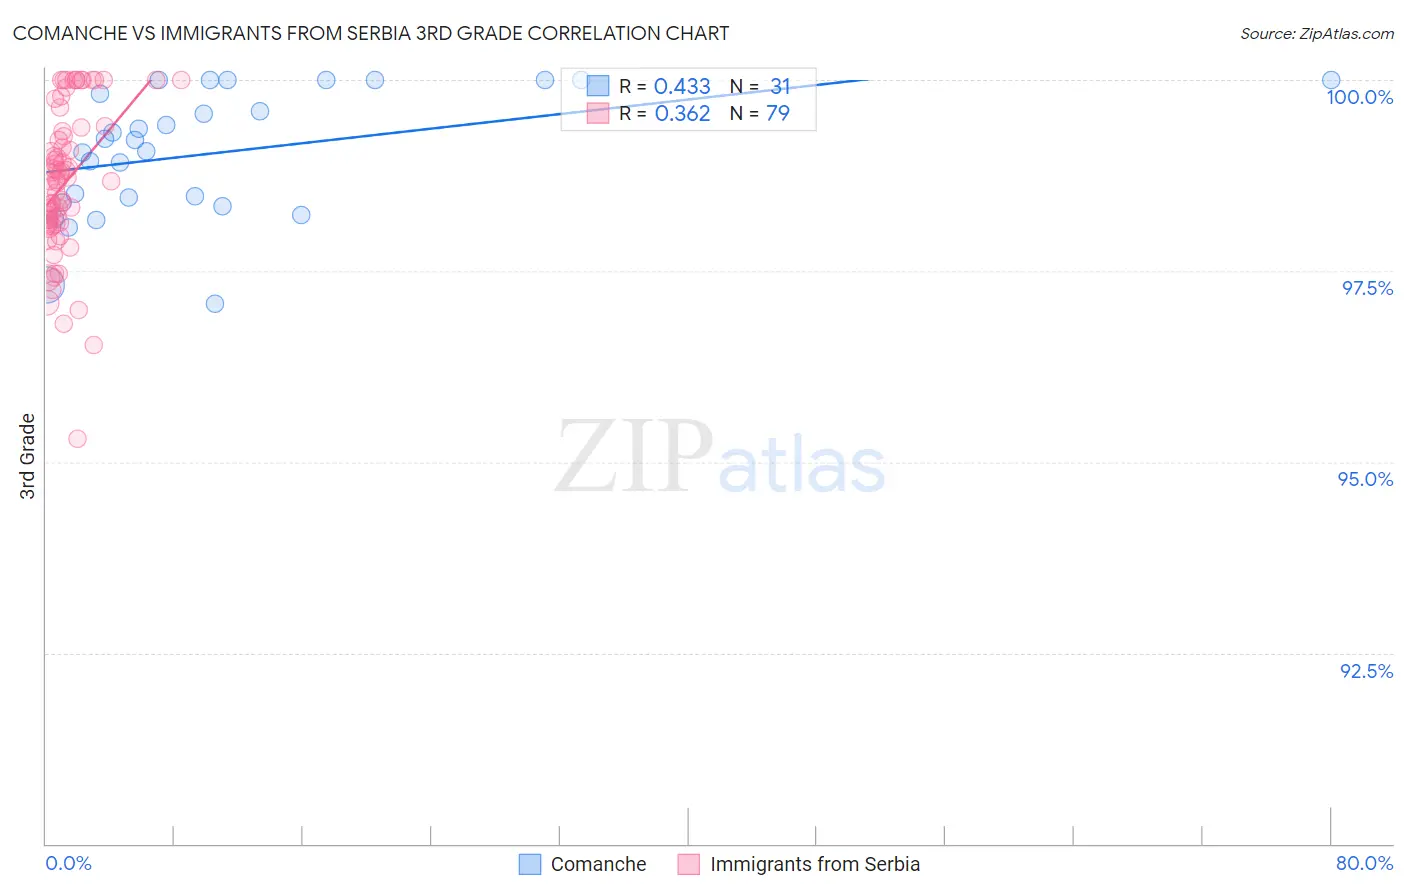
Comanche vs Immigrants from Serbia 3rd Grade Correlation Chart
The statistical analysis conducted on geographies consisting of 109,786,530 people shows a moderate positive correlation between the proportion of Comanche and percentage of population with at least 3rd grade education in the United States with a correlation coefficient (R) of 0.433 and weighted average of 97.8%. Similarly, the statistical analysis conducted on geographies consisting of 131,729,423 people shows a mild positive correlation between the proportion of Immigrants from Serbia and percentage of population with at least 3rd grade education in the United States with a correlation coefficient (R) of 0.362 and weighted average of 98.0%, a difference of 0.19%.
3rd Grade Correlation Summary
| Measurement | Comanche | Immigrants from Serbia |
| Minimum | 97.1% | 95.3% |
| Maximum | 100.0% | 100.0% |
| Range | 2.9% | 4.7% |
| Mean | 99.1% | 98.7% |
| Median | 99.2% | 98.7% |
| Interquartile 25% (IQ1) | 98.4% | 98.1% |
| Interquartile 75% (IQ3) | 100.0% | 99.3% |
| Interquartile Range (IQR) | 1.6% | 1.2% |
| Standard Deviation (Sample) | 0.83% | 0.96% |
| Standard Deviation (Population) | 0.82% | 0.95% |
Similar Demographics by 3rd Grade
Demographics Similar to Comanche by 3rd Grade
In terms of 3rd grade, the demographic groups most similar to Comanche are Immigrants from Spain (97.8%, a difference of 0.0%), Brazilian (97.8%, a difference of 0.0%), Immigrants from Jordan (97.8%, a difference of 0.010%), Marshallese (97.8%, a difference of 0.010%), and Immigrants from Bosnia and Herzegovina (97.8%, a difference of 0.010%).
| Demographics | Rating | Rank | 3rd Grade |
| Immigrants | Jordan | 57.9 /100 | #162 | Average 97.8% |
| Marshallese | 57.2 /100 | #163 | Average 97.8% |
| Immigrants | Bosnia and Herzegovina | 56.2 /100 | #164 | Average 97.8% |
| Ugandans | 56.1 /100 | #165 | Average 97.8% |
| Dutch West Indians | 55.5 /100 | #166 | Average 97.8% |
| Chileans | 55.3 /100 | #167 | Average 97.8% |
| Immigrants | Spain | 54.3 /100 | #168 | Average 97.8% |
| Comanche | 53.8 /100 | #169 | Average 97.8% |
| Brazilians | 53.7 /100 | #170 | Average 97.8% |
| Kenyans | 51.8 /100 | #171 | Average 97.8% |
| Spanish Americans | 51.8 /100 | #172 | Average 97.8% |
| Immigrants | Korea | 50.9 /100 | #173 | Average 97.8% |
| Navajo | 50.0 /100 | #174 | Average 97.8% |
| Immigrants | Micronesia | 47.6 /100 | #175 | Average 97.8% |
| Immigrants | Poland | 47.1 /100 | #176 | Average 97.8% |
Demographics Similar to Immigrants from Serbia by 3rd Grade
In terms of 3rd grade, the demographic groups most similar to Immigrants from Serbia are Colville (98.0%, a difference of 0.0%), Immigrants from Europe (98.0%, a difference of 0.010%), Syrian (98.0%, a difference of 0.020%), Immigrants from Japan (98.0%, a difference of 0.020%), and Immigrants from Saudi Arabia (98.0%, a difference of 0.020%).
| Demographics | Rating | Rank | 3rd Grade |
| Lebanese | 94.1 /100 | #122 | Exceptional 98.0% |
| Syrians | 93.8 /100 | #123 | Exceptional 98.0% |
| Immigrants | Japan | 93.7 /100 | #124 | Exceptional 98.0% |
| Immigrants | Saudi Arabia | 93.5 /100 | #125 | Exceptional 98.0% |
| Immigrants | Zimbabwe | 93.4 /100 | #126 | Exceptional 98.0% |
| Ute | 93.2 /100 | #127 | Exceptional 98.0% |
| Colville | 92.1 /100 | #128 | Exceptional 98.0% |
| Immigrants | Serbia | 91.9 /100 | #129 | Exceptional 98.0% |
| Immigrants | Europe | 91.2 /100 | #130 | Exceptional 98.0% |
| Immigrants | Bulgaria | 89.1 /100 | #131 | Excellent 97.9% |
| Immigrants | Hungary | 88.8 /100 | #132 | Excellent 97.9% |
| Immigrants | Kuwait | 88.7 /100 | #133 | Excellent 97.9% |
| Seminole | 88.7 /100 | #134 | Excellent 97.9% |
| Cambodians | 88.1 /100 | #135 | Excellent 97.9% |
| Spaniards | 87.9 /100 | #136 | Excellent 97.9% |