Ukrainian vs Immigrants from Serbia 3rd Grade
COMPARE
Ukrainian
Immigrants from Serbia
3rd Grade
3rd Grade Comparison
Ukrainians
Immigrants from Serbia
98.1%
3RD GRADE
98.9/ 100
METRIC RATING
83rd/ 347
METRIC RANK
98.0%
3RD GRADE
91.9/ 100
METRIC RATING
129th/ 347
METRIC RANK
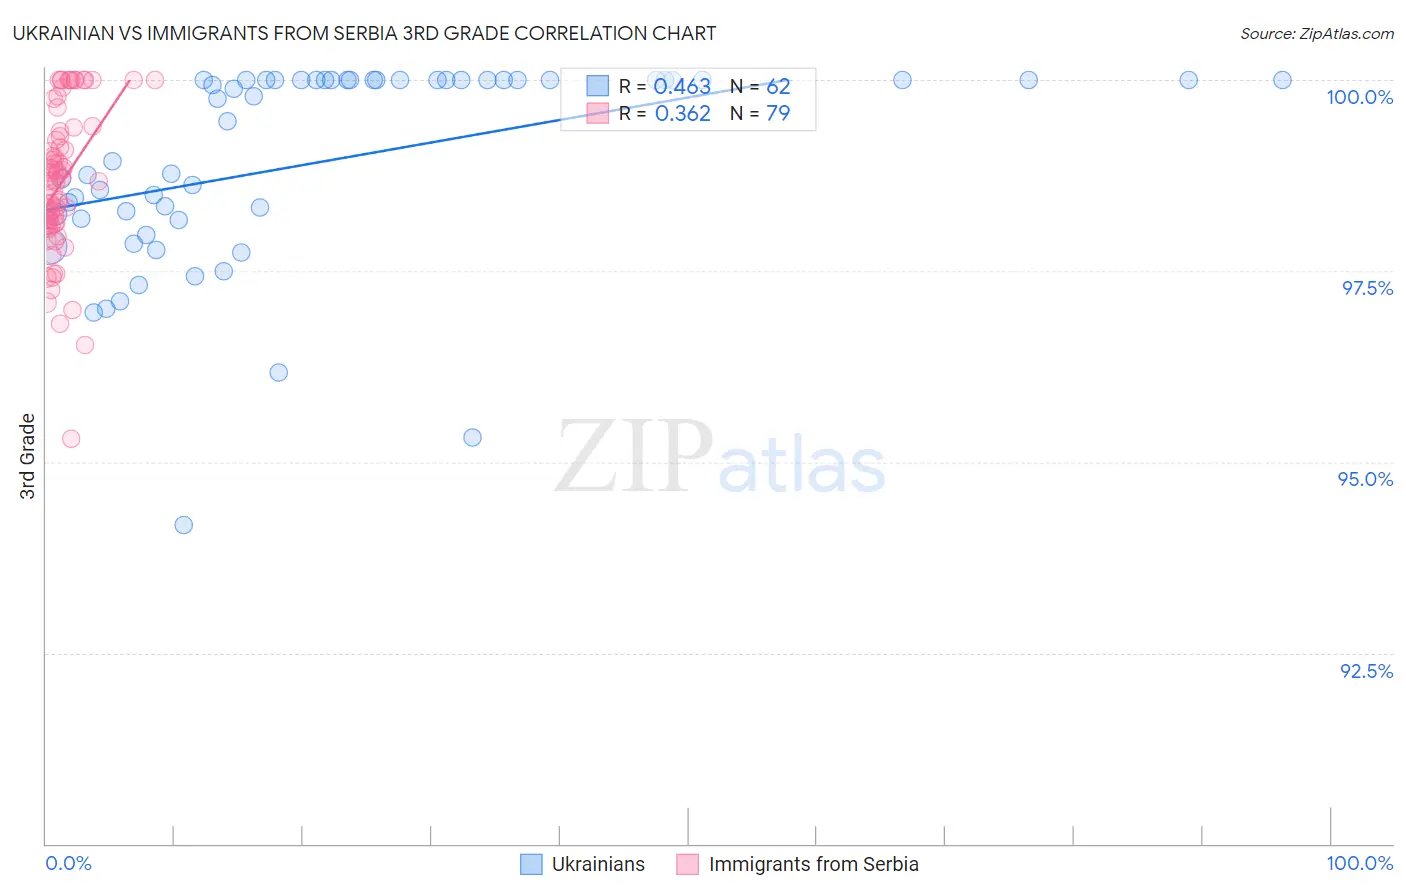
Ukrainian vs Immigrants from Serbia 3rd Grade Correlation Chart
The statistical analysis conducted on geographies consisting of 448,698,169 people shows a moderate positive correlation between the proportion of Ukrainians and percentage of population with at least 3rd grade education in the United States with a correlation coefficient (R) of 0.463 and weighted average of 98.1%. Similarly, the statistical analysis conducted on geographies consisting of 131,729,423 people shows a mild positive correlation between the proportion of Immigrants from Serbia and percentage of population with at least 3rd grade education in the United States with a correlation coefficient (R) of 0.362 and weighted average of 98.0%, a difference of 0.18%.
3rd Grade Correlation Summary
| Measurement | Ukrainian | Immigrants from Serbia |
| Minimum | 94.2% | 95.3% |
| Maximum | 100.0% | 100.0% |
| Range | 5.8% | 4.7% |
| Mean | 98.9% | 98.7% |
| Median | 99.8% | 98.7% |
| Interquartile 25% (IQ1) | 98.2% | 98.1% |
| Interquartile 75% (IQ3) | 100.0% | 99.3% |
| Interquartile Range (IQR) | 1.8% | 1.2% |
| Standard Deviation (Sample) | 1.3% | 0.96% |
| Standard Deviation (Population) | 1.3% | 0.95% |
Similar Demographics by 3rd Grade
Demographics Similar to Ukrainians by 3rd Grade
In terms of 3rd grade, the demographic groups most similar to Ukrainians are Immigrants from Sweden (98.1%, a difference of 0.0%), Immigrants from Belgium (98.1%, a difference of 0.010%), Macedonian (98.1%, a difference of 0.010%), Icelander (98.1%, a difference of 0.010%), and Shoshone (98.1%, a difference of 0.010%).
| Demographics | Rating | Rank | 3rd Grade |
| Immigrants | England | 99.2 /100 | #76 | Exceptional 98.2% |
| Immigrants | Lithuania | 99.2 /100 | #77 | Exceptional 98.2% |
| Osage | 99.2 /100 | #78 | Exceptional 98.2% |
| Immigrants | Belgium | 99.1 /100 | #79 | Exceptional 98.1% |
| Macedonians | 99.1 /100 | #80 | Exceptional 98.1% |
| Icelanders | 99.1 /100 | #81 | Exceptional 98.1% |
| Shoshone | 99.0 /100 | #82 | Exceptional 98.1% |
| Ukrainians | 98.9 /100 | #83 | Exceptional 98.1% |
| Immigrants | Sweden | 98.9 /100 | #84 | Exceptional 98.1% |
| Immigrants | Australia | 98.9 /100 | #85 | Exceptional 98.1% |
| Potawatomi | 98.9 /100 | #86 | Exceptional 98.1% |
| Immigrants | Denmark | 98.8 /100 | #87 | Exceptional 98.1% |
| Immigrants | India | 98.8 /100 | #88 | Exceptional 98.1% |
| Delaware | 98.8 /100 | #89 | Exceptional 98.1% |
| Zimbabweans | 98.8 /100 | #90 | Exceptional 98.1% |
Demographics Similar to Immigrants from Serbia by 3rd Grade
In terms of 3rd grade, the demographic groups most similar to Immigrants from Serbia are Colville (98.0%, a difference of 0.0%), Immigrants from Europe (98.0%, a difference of 0.010%), Syrian (98.0%, a difference of 0.020%), Immigrants from Japan (98.0%, a difference of 0.020%), and Immigrants from Saudi Arabia (98.0%, a difference of 0.020%).
| Demographics | Rating | Rank | 3rd Grade |
| Lebanese | 94.1 /100 | #122 | Exceptional 98.0% |
| Syrians | 93.8 /100 | #123 | Exceptional 98.0% |
| Immigrants | Japan | 93.7 /100 | #124 | Exceptional 98.0% |
| Immigrants | Saudi Arabia | 93.5 /100 | #125 | Exceptional 98.0% |
| Immigrants | Zimbabwe | 93.4 /100 | #126 | Exceptional 98.0% |
| Ute | 93.2 /100 | #127 | Exceptional 98.0% |
| Colville | 92.1 /100 | #128 | Exceptional 98.0% |
| Immigrants | Serbia | 91.9 /100 | #129 | Exceptional 98.0% |
| Immigrants | Europe | 91.2 /100 | #130 | Exceptional 98.0% |
| Immigrants | Bulgaria | 89.1 /100 | #131 | Excellent 97.9% |
| Immigrants | Hungary | 88.8 /100 | #132 | Excellent 97.9% |
| Immigrants | Kuwait | 88.7 /100 | #133 | Excellent 97.9% |
| Seminole | 88.7 /100 | #134 | Excellent 97.9% |
| Cambodians | 88.1 /100 | #135 | Excellent 97.9% |
| Spaniards | 87.9 /100 | #136 | Excellent 97.9% |