Choctaw vs Thai 10th Grade
COMPARE
Choctaw
Thai
10th Grade
10th Grade Comparison
Choctaw
Thais
93.6%
10TH GRADE
36.6/ 100
METRIC RATING
184th/ 347
METRIC RANK
95.0%
10TH GRADE
99.8/ 100
METRIC RATING
62nd/ 347
METRIC RANK
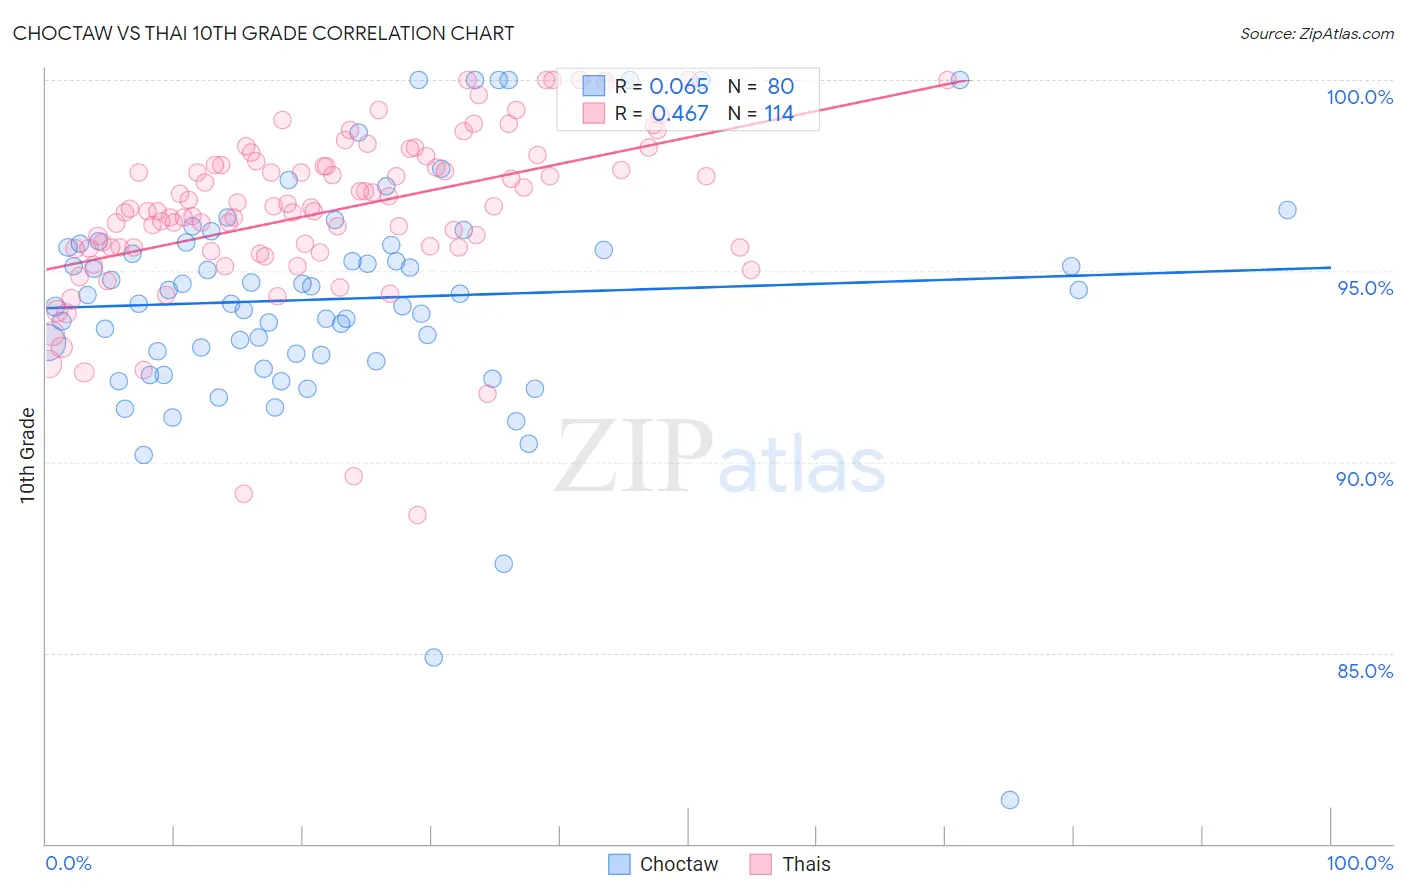
Choctaw vs Thai 10th Grade Correlation Chart
The statistical analysis conducted on geographies consisting of 269,742,499 people shows a slight positive correlation between the proportion of Choctaw and percentage of population with at least 10th grade education in the United States with a correlation coefficient (R) of 0.065 and weighted average of 93.6%. Similarly, the statistical analysis conducted on geographies consisting of 475,814,962 people shows a moderate positive correlation between the proportion of Thais and percentage of population with at least 10th grade education in the United States with a correlation coefficient (R) of 0.467 and weighted average of 95.0%, a difference of 1.5%.
10th Grade Correlation Summary
| Measurement | Choctaw | Thai |
| Minimum | 81.1% | 88.6% |
| Maximum | 100.0% | 100.0% |
| Range | 18.9% | 11.4% |
| Mean | 94.3% | 96.5% |
| Median | 94.4% | 96.6% |
| Interquartile 25% (IQ1) | 92.8% | 95.6% |
| Interquartile 75% (IQ3) | 95.7% | 97.8% |
| Interquartile Range (IQR) | 2.9% | 2.2% |
| Standard Deviation (Sample) | 3.1% | 2.2% |
| Standard Deviation (Population) | 3.1% | 2.1% |
Similar Demographics by 10th Grade
Demographics Similar to Choctaw by 10th Grade
In terms of 10th grade, the demographic groups most similar to Choctaw are Guamanian/Chamorro (93.6%, a difference of 0.0%), Sudanese (93.6%, a difference of 0.0%), Colville (93.6%, a difference of 0.020%), Immigrants from Eastern Asia (93.6%, a difference of 0.020%), and Liberian (93.6%, a difference of 0.020%).
| Demographics | Rating | Rank | 10th Grade |
| Immigrants | Lebanon | 47.1 /100 | #177 | Average 93.7% |
| Sierra Leoneans | 46.1 /100 | #178 | Average 93.7% |
| Paraguayans | 45.3 /100 | #179 | Average 93.7% |
| Blackfeet | 42.8 /100 | #180 | Average 93.7% |
| Immigrants | Northern Africa | 41.6 /100 | #181 | Average 93.7% |
| Colville | 38.8 /100 | #182 | Fair 93.6% |
| Guamanians/Chamorros | 37.1 /100 | #183 | Fair 93.6% |
| Choctaw | 36.6 /100 | #184 | Fair 93.6% |
| Sudanese | 36.6 /100 | #185 | Fair 93.6% |
| Immigrants | Eastern Asia | 35.1 /100 | #186 | Fair 93.6% |
| Liberians | 34.7 /100 | #187 | Fair 93.6% |
| Marshallese | 33.2 /100 | #188 | Fair 93.6% |
| Immigrants | Pakistan | 32.5 /100 | #189 | Fair 93.6% |
| Laotians | 32.1 /100 | #190 | Fair 93.6% |
| Yup'ik | 31.1 /100 | #191 | Fair 93.6% |
Demographics Similar to Thais by 10th Grade
In terms of 10th grade, the demographic groups most similar to Thais are Immigrants from Singapore (95.0%, a difference of 0.0%), Cypriot (95.0%, a difference of 0.010%), Chippewa (95.0%, a difference of 0.010%), Native Hawaiian (95.0%, a difference of 0.010%), and Ukrainian (95.0%, a difference of 0.020%).
| Demographics | Rating | Rank | 10th Grade |
| Immigrants | Ireland | 99.8 /100 | #55 | Exceptional 95.0% |
| New Zealanders | 99.8 /100 | #56 | Exceptional 95.0% |
| Ukrainians | 99.8 /100 | #57 | Exceptional 95.0% |
| Aleuts | 99.8 /100 | #58 | Exceptional 95.0% |
| Celtics | 99.8 /100 | #59 | Exceptional 95.0% |
| Cypriots | 99.8 /100 | #60 | Exceptional 95.0% |
| Chippewa | 99.8 /100 | #61 | Exceptional 95.0% |
| Thais | 99.8 /100 | #62 | Exceptional 95.0% |
| Immigrants | Singapore | 99.8 /100 | #63 | Exceptional 95.0% |
| Native Hawaiians | 99.7 /100 | #64 | Exceptional 95.0% |
| Turks | 99.7 /100 | #65 | Exceptional 95.0% |
| Immigrants | Australia | 99.7 /100 | #66 | Exceptional 94.9% |
| Immigrants | Netherlands | 99.7 /100 | #67 | Exceptional 94.9% |
| Immigrants | Belgium | 99.7 /100 | #68 | Exceptional 94.9% |
| Immigrants | England | 99.6 /100 | #69 | Exceptional 94.9% |