Immigrants from Austria vs Thai 10th Grade
COMPARE
Immigrants from Austria
Thai
10th Grade
10th Grade Comparison
Immigrants from Austria
Thais
95.1%
10TH GRADE
99.9/ 100
METRIC RATING
49th/ 347
METRIC RANK
95.0%
10TH GRADE
99.8/ 100
METRIC RATING
62nd/ 347
METRIC RANK
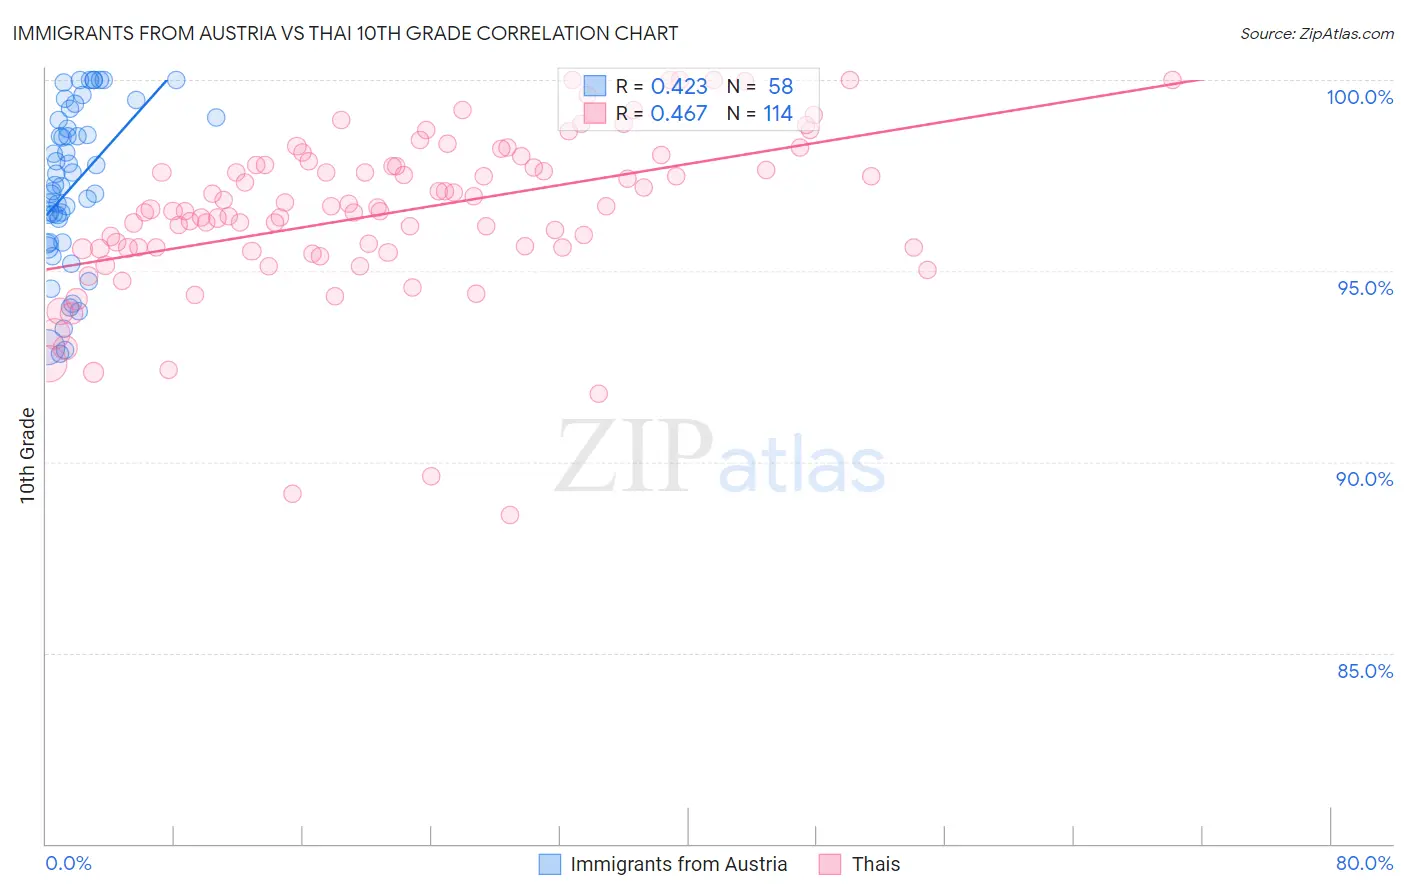
Immigrants from Austria vs Thai 10th Grade Correlation Chart
The statistical analysis conducted on geographies consisting of 167,973,618 people shows a moderate positive correlation between the proportion of Immigrants from Austria and percentage of population with at least 10th grade education in the United States with a correlation coefficient (R) of 0.423 and weighted average of 95.1%. Similarly, the statistical analysis conducted on geographies consisting of 475,814,962 people shows a moderate positive correlation between the proportion of Thais and percentage of population with at least 10th grade education in the United States with a correlation coefficient (R) of 0.467 and weighted average of 95.0%, a difference of 0.11%.
10th Grade Correlation Summary
| Measurement | Immigrants from Austria | Thai |
| Minimum | 92.8% | 88.6% |
| Maximum | 100.0% | 100.0% |
| Range | 7.2% | 11.4% |
| Mean | 97.2% | 96.5% |
| Median | 97.2% | 96.6% |
| Interquartile 25% (IQ1) | 95.7% | 95.6% |
| Interquartile 75% (IQ3) | 98.9% | 97.8% |
| Interquartile Range (IQR) | 3.2% | 2.2% |
| Standard Deviation (Sample) | 2.1% | 2.2% |
| Standard Deviation (Population) | 2.0% | 2.1% |
Demographics Similar to Immigrants from Austria and Thais by 10th Grade
In terms of 10th grade, the demographic groups most similar to Immigrants from Austria are Australian (95.1%, a difference of 0.030%), Immigrants from Canada (95.1%, a difference of 0.030%), Austrian (95.1%, a difference of 0.030%), Serbian (95.1%, a difference of 0.040%), and Ottawa (95.1%, a difference of 0.040%). Similarly, the demographic groups most similar to Thais are Immigrants from Singapore (95.0%, a difference of 0.0%), Cypriot (95.0%, a difference of 0.010%), Chippewa (95.0%, a difference of 0.010%), Native Hawaiian (95.0%, a difference of 0.010%), and Ukrainian (95.0%, a difference of 0.020%).
| Demographics | Rating | Rank | 10th Grade |
| Greeks | 99.9 /100 | #45 | Exceptional 95.2% |
| Czechoslovakians | 99.9 /100 | #46 | Exceptional 95.1% |
| Serbians | 99.9 /100 | #47 | Exceptional 95.1% |
| Australians | 99.9 /100 | #48 | Exceptional 95.1% |
| Immigrants | Austria | 99.9 /100 | #49 | Exceptional 95.1% |
| Immigrants | Canada | 99.8 /100 | #50 | Exceptional 95.1% |
| Austrians | 99.8 /100 | #51 | Exceptional 95.1% |
| Ottawa | 99.8 /100 | #52 | Exceptional 95.1% |
| Immigrants | North America | 99.8 /100 | #53 | Exceptional 95.0% |
| Immigrants | Lithuania | 99.8 /100 | #54 | Exceptional 95.0% |
| Immigrants | Ireland | 99.8 /100 | #55 | Exceptional 95.0% |
| New Zealanders | 99.8 /100 | #56 | Exceptional 95.0% |
| Ukrainians | 99.8 /100 | #57 | Exceptional 95.0% |
| Aleuts | 99.8 /100 | #58 | Exceptional 95.0% |
| Celtics | 99.8 /100 | #59 | Exceptional 95.0% |
| Cypriots | 99.8 /100 | #60 | Exceptional 95.0% |
| Chippewa | 99.8 /100 | #61 | Exceptional 95.0% |
| Thais | 99.8 /100 | #62 | Exceptional 95.0% |
| Immigrants | Singapore | 99.8 /100 | #63 | Exceptional 95.0% |
| Native Hawaiians | 99.7 /100 | #64 | Exceptional 95.0% |
| Turks | 99.7 /100 | #65 | Exceptional 95.0% |