Chickasaw vs Immigrants from Zimbabwe 9th Grade
COMPARE
Chickasaw
Immigrants from Zimbabwe
9th Grade
9th Grade Comparison
Chickasaw
Immigrants from Zimbabwe
95.5%
9TH GRADE
96.8/ 100
METRIC RATING
108th/ 347
METRIC RANK
95.5%
9TH GRADE
96.9/ 100
METRIC RATING
107th/ 347
METRIC RANK
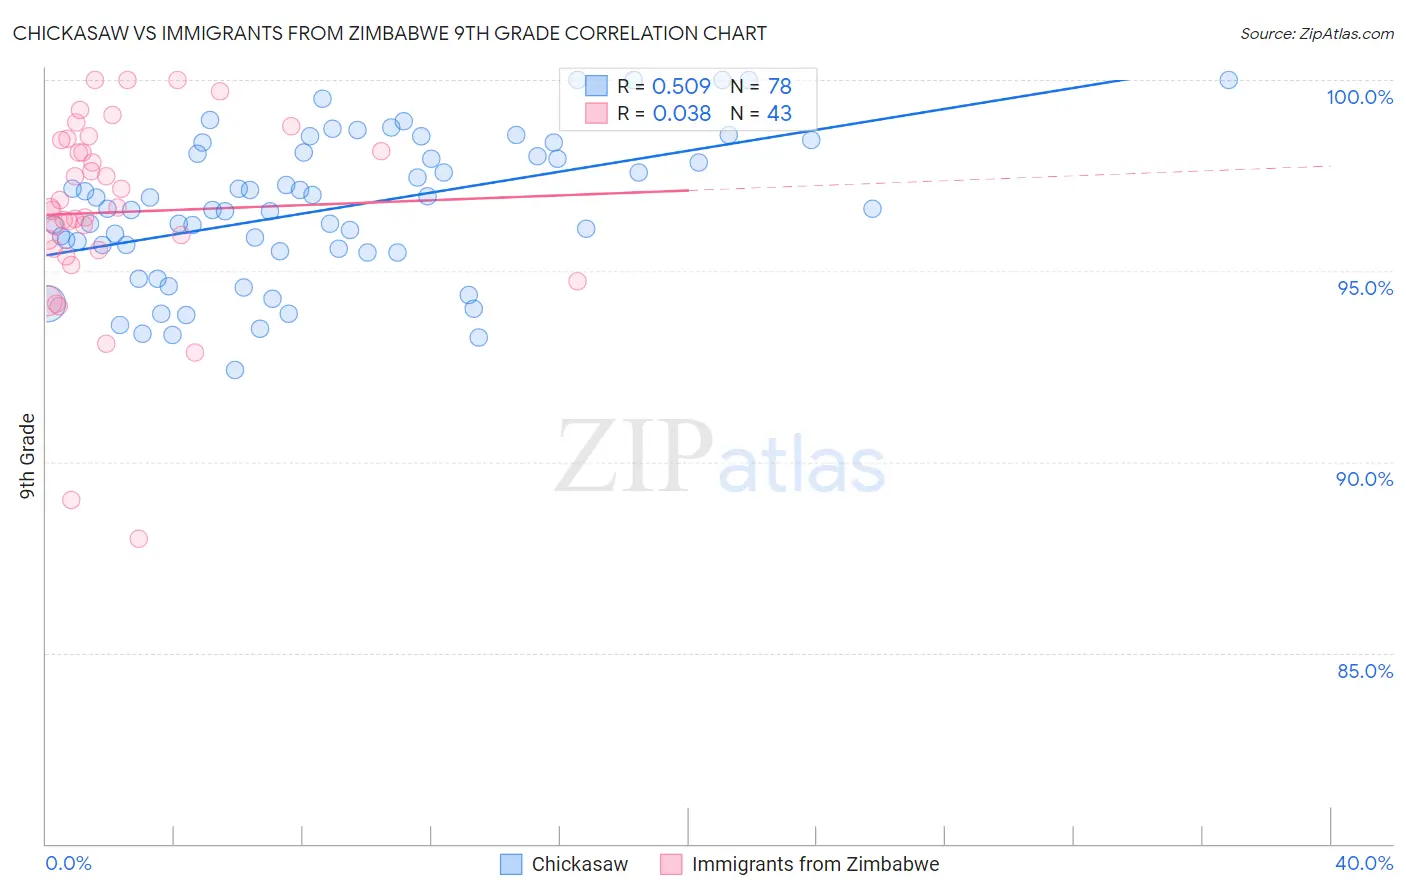
Chickasaw vs Immigrants from Zimbabwe 9th Grade Correlation Chart
The statistical analysis conducted on geographies consisting of 147,726,505 people shows a substantial positive correlation between the proportion of Chickasaw and percentage of population with at least 9th grade education in the United States with a correlation coefficient (R) of 0.509 and weighted average of 95.5%. Similarly, the statistical analysis conducted on geographies consisting of 117,809,691 people shows no correlation between the proportion of Immigrants from Zimbabwe and percentage of population with at least 9th grade education in the United States with a correlation coefficient (R) of 0.038 and weighted average of 95.5%, a difference of 0.0%.
9th Grade Correlation Summary
| Measurement | Chickasaw | Immigrants from Zimbabwe |
| Minimum | 92.4% | 88.0% |
| Maximum | 100.0% | 100.0% |
| Range | 7.6% | 12.0% |
| Mean | 96.6% | 96.5% |
| Median | 96.6% | 96.7% |
| Interquartile 25% (IQ1) | 95.5% | 95.5% |
| Interquartile 75% (IQ3) | 98.1% | 98.4% |
| Interquartile Range (IQR) | 2.6% | 2.9% |
| Standard Deviation (Sample) | 1.9% | 2.6% |
| Standard Deviation (Population) | 1.9% | 2.5% |
Demographics Similar to Chickasaw and Immigrants from Zimbabwe by 9th Grade
In terms of 9th grade, the demographic groups most similar to Chickasaw are Osage (95.5%, a difference of 0.0%), Immigrants from Bulgaria (95.5%, a difference of 0.0%), Immigrants from Norway (95.5%, a difference of 0.020%), Immigrants from France (95.5%, a difference of 0.030%), and Cherokee (95.4%, a difference of 0.030%). Similarly, the demographic groups most similar to Immigrants from Zimbabwe are Osage (95.5%, a difference of 0.010%), Immigrants from Bulgaria (95.5%, a difference of 0.010%), Immigrants from Norway (95.5%, a difference of 0.020%), Syrian (95.5%, a difference of 0.030%), and Immigrants from France (95.5%, a difference of 0.030%).
| Demographics | Rating | Rank | 9th Grade |
| Delaware | 98.4 /100 | #97 | Exceptional 95.6% |
| Immigrants | Japan | 98.4 /100 | #98 | Exceptional 95.6% |
| Menominee | 98.3 /100 | #99 | Exceptional 95.6% |
| Lebanese | 98.1 /100 | #100 | Exceptional 95.6% |
| Immigrants | Moldova | 97.9 /100 | #101 | Exceptional 95.5% |
| Immigrants | Switzerland | 97.7 /100 | #102 | Exceptional 95.5% |
| Potawatomi | 97.7 /100 | #103 | Exceptional 95.5% |
| Syrians | 97.4 /100 | #104 | Exceptional 95.5% |
| Immigrants | France | 97.4 /100 | #105 | Exceptional 95.5% |
| Immigrants | Norway | 97.1 /100 | #106 | Exceptional 95.5% |
| Immigrants | Zimbabwe | 96.9 /100 | #107 | Exceptional 95.5% |
| Chickasaw | 96.8 /100 | #108 | Exceptional 95.5% |
| Osage | 96.8 /100 | #109 | Exceptional 95.5% |
| Immigrants | Bulgaria | 96.7 /100 | #110 | Exceptional 95.5% |
| Cherokee | 96.3 /100 | #111 | Exceptional 95.4% |
| Immigrants | Croatia | 96.2 /100 | #112 | Exceptional 95.4% |
| Iroquois | 96.2 /100 | #113 | Exceptional 95.4% |
| German Russians | 96.1 /100 | #114 | Exceptional 95.4% |
| Burmese | 96.0 /100 | #115 | Exceptional 95.4% |
| Immigrants | Europe | 95.7 /100 | #116 | Exceptional 95.4% |
| Immigrants | Romania | 95.6 /100 | #117 | Exceptional 95.4% |