Chickasaw vs Egyptian 11th Grade
COMPARE
Chickasaw
Egyptian
11th Grade
11th Grade Comparison
Chickasaw
Egyptians
92.3%
11TH GRADE
31.4/ 100
METRIC RATING
190th/ 347
METRIC RANK
93.0%
11TH GRADE
89.5/ 100
METRIC RATING
131st/ 347
METRIC RANK
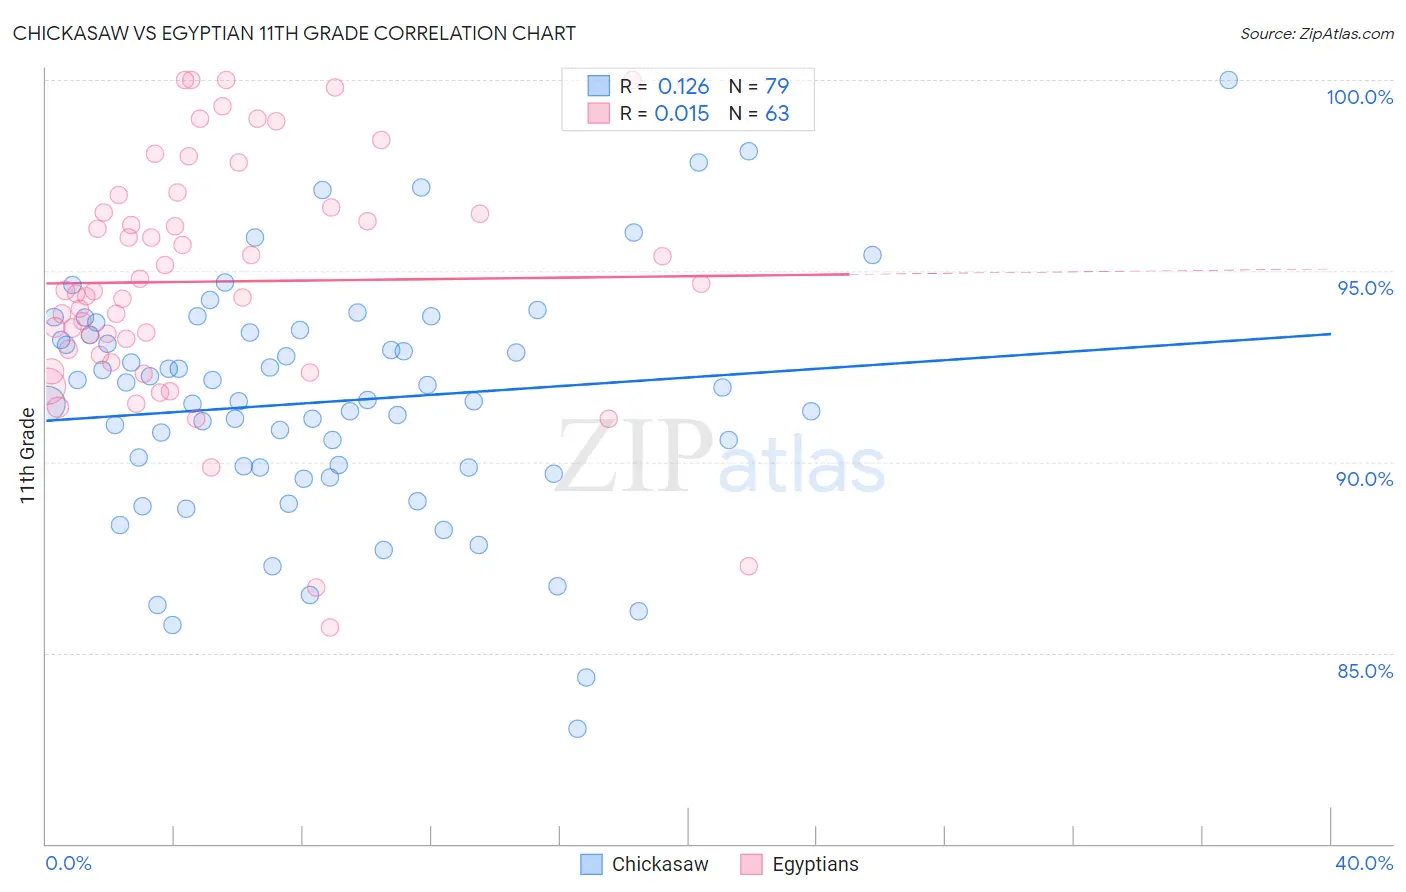
Chickasaw vs Egyptian 11th Grade Correlation Chart
The statistical analysis conducted on geographies consisting of 147,726,791 people shows a poor positive correlation between the proportion of Chickasaw and percentage of population with at least 11th grade education in the United States with a correlation coefficient (R) of 0.126 and weighted average of 92.3%. Similarly, the statistical analysis conducted on geographies consisting of 276,927,519 people shows no correlation between the proportion of Egyptians and percentage of population with at least 11th grade education in the United States with a correlation coefficient (R) of 0.015 and weighted average of 93.0%, a difference of 0.72%.
11th Grade Correlation Summary
| Measurement | Chickasaw | Egyptian |
| Minimum | 83.0% | 85.7% |
| Maximum | 100.0% | 100.0% |
| Range | 17.0% | 14.3% |
| Mean | 91.6% | 94.7% |
| Median | 91.6% | 94.5% |
| Interquartile 25% (IQ1) | 89.8% | 92.8% |
| Interquartile 75% (IQ3) | 93.4% | 96.7% |
| Interquartile Range (IQR) | 3.5% | 3.9% |
| Standard Deviation (Sample) | 3.1% | 3.2% |
| Standard Deviation (Population) | 3.1% | 3.2% |
Similar Demographics by 11th Grade
Demographics Similar to Chickasaw by 11th Grade
In terms of 11th grade, the demographic groups most similar to Chickasaw are French American Indian (92.3%, a difference of 0.010%), Immigrants from Syria (92.3%, a difference of 0.010%), Immigrants from Chile (92.4%, a difference of 0.020%), Immigrants from Indonesia (92.4%, a difference of 0.030%), and Moroccan (92.3%, a difference of 0.030%).
| Demographics | Rating | Rank | 11th Grade |
| Immigrants | Malaysia | 37.6 /100 | #183 | Fair 92.4% |
| Immigrants | Asia | 37.4 /100 | #184 | Fair 92.4% |
| Immigrants | Nepal | 36.4 /100 | #185 | Fair 92.4% |
| Arapaho | 35.1 /100 | #186 | Fair 92.4% |
| Immigrants | Western Asia | 35.0 /100 | #187 | Fair 92.4% |
| Immigrants | Indonesia | 33.7 /100 | #188 | Fair 92.4% |
| Immigrants | Chile | 33.3 /100 | #189 | Fair 92.4% |
| Chickasaw | 31.4 /100 | #190 | Fair 92.3% |
| French American Indians | 30.8 /100 | #191 | Fair 92.3% |
| Immigrants | Syria | 30.4 /100 | #192 | Fair 92.3% |
| Moroccans | 28.7 /100 | #193 | Fair 92.3% |
| Sioux | 28.5 /100 | #194 | Fair 92.3% |
| Liberians | 26.8 /100 | #195 | Fair 92.3% |
| Panamanians | 26.4 /100 | #196 | Fair 92.3% |
| Marshallese | 26.0 /100 | #197 | Fair 92.3% |
Demographics Similar to Egyptians by 11th Grade
In terms of 11th grade, the demographic groups most similar to Egyptians are Albanian (93.0%, a difference of 0.0%), Immigrants from Ukraine (93.0%, a difference of 0.010%), Immigrants from Bosnia and Herzegovina (93.0%, a difference of 0.010%), Mongolian (93.0%, a difference of 0.050%), and Delaware (93.0%, a difference of 0.050%).
| Demographics | Rating | Rank | 11th Grade |
| Immigrants | Eastern Europe | 95.9 /100 | #124 | Exceptional 93.2% |
| Immigrants | Sri Lanka | 95.6 /100 | #125 | Exceptional 93.2% |
| Basques | 95.2 /100 | #126 | Exceptional 93.2% |
| Immigrants | Kazakhstan | 92.4 /100 | #127 | Exceptional 93.1% |
| Immigrants | Jordan | 92.4 /100 | #128 | Exceptional 93.1% |
| Immigrants | Ukraine | 89.8 /100 | #129 | Excellent 93.0% |
| Albanians | 89.5 /100 | #130 | Excellent 93.0% |
| Egyptians | 89.5 /100 | #131 | Excellent 93.0% |
| Immigrants | Bosnia and Herzegovina | 89.0 /100 | #132 | Excellent 93.0% |
| Mongolians | 87.6 /100 | #133 | Excellent 93.0% |
| Delaware | 87.3 /100 | #134 | Excellent 93.0% |
| Immigrants | Italy | 86.6 /100 | #135 | Excellent 92.9% |
| Cree | 85.9 /100 | #136 | Excellent 92.9% |
| Arabs | 85.4 /100 | #137 | Excellent 92.9% |
| Immigrants | Brazil | 85.1 /100 | #138 | Excellent 92.9% |