Immigrants from Senegal vs Haitian Associate's Degree
COMPARE
Immigrants from Senegal
Haitian
Associate's Degree
Associate's Degree Comparison
Immigrants from Senegal
Haitians
45.2%
ASSOCIATE'S DEGREE
21.2/ 100
METRIC RATING
199th/ 347
METRIC RANK
40.0%
ASSOCIATE'S DEGREE
0.1/ 100
METRIC RATING
283rd/ 347
METRIC RANK
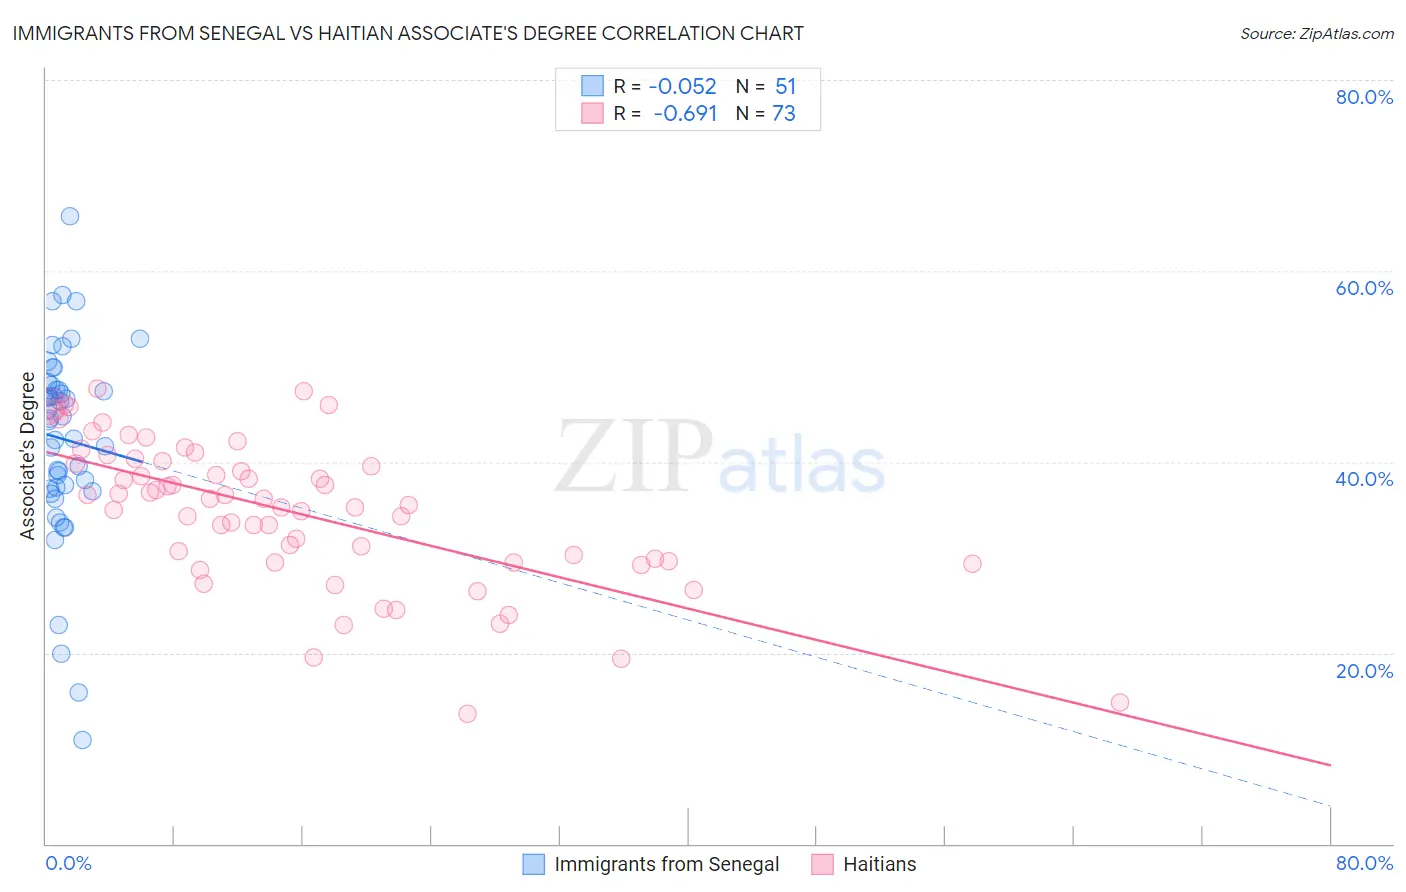
Immigrants from Senegal vs Haitian Associate's Degree Correlation Chart
The statistical analysis conducted on geographies consisting of 90,125,204 people shows a slight negative correlation between the proportion of Immigrants from Senegal and percentage of population with at least associate's degree education in the United States with a correlation coefficient (R) of -0.052 and weighted average of 45.2%. Similarly, the statistical analysis conducted on geographies consisting of 287,980,530 people shows a significant negative correlation between the proportion of Haitians and percentage of population with at least associate's degree education in the United States with a correlation coefficient (R) of -0.691 and weighted average of 40.0%, a difference of 13.2%.
Associate's Degree Correlation Summary
| Measurement | Immigrants from Senegal | Haitian |
| Minimum | 10.9% | 13.6% |
| Maximum | 65.7% | 47.6% |
| Range | 54.8% | 34.0% |
| Mean | 42.4% | 34.8% |
| Median | 44.5% | 36.1% |
| Interquartile 25% (IQ1) | 37.2% | 29.5% |
| Interquartile 75% (IQ3) | 48.1% | 40.2% |
| Interquartile Range (IQR) | 10.9% | 10.7% |
| Standard Deviation (Sample) | 10.3% | 7.7% |
| Standard Deviation (Population) | 10.2% | 7.6% |
Similar Demographics by Associate's Degree
Demographics Similar to Immigrants from Senegal by Associate's Degree
In terms of associate's degree, the demographic groups most similar to Immigrants from Senegal are Senegalese (45.2%, a difference of 0.010%), Immigrants from Bangladesh (45.2%, a difference of 0.020%), Immigrants from Vietnam (45.2%, a difference of 0.040%), Spaniard (45.2%, a difference of 0.090%), and Immigrants from South Eastern Asia (45.2%, a difference of 0.11%).
| Demographics | Rating | Rank | Associate's Degree |
| Celtics | 33.3 /100 | #192 | Fair 45.8% |
| Immigrants | Cameroon | 31.0 /100 | #193 | Fair 45.7% |
| Immigrants | Peru | 27.6 /100 | #194 | Fair 45.5% |
| Germans | 26.5 /100 | #195 | Fair 45.5% |
| French | 25.6 /100 | #196 | Fair 45.4% |
| Scotch-Irish | 22.3 /100 | #197 | Fair 45.3% |
| Immigrants | Bangladesh | 21.3 /100 | #198 | Fair 45.2% |
| Immigrants | Senegal | 21.2 /100 | #199 | Fair 45.2% |
| Senegalese | 21.1 /100 | #200 | Fair 45.2% |
| Immigrants | Vietnam | 20.8 /100 | #201 | Fair 45.2% |
| Spaniards | 20.4 /100 | #202 | Fair 45.2% |
| Immigrants | South Eastern Asia | 20.2 /100 | #203 | Fair 45.2% |
| Nigerians | 19.1 /100 | #204 | Poor 45.1% |
| Immigrants | Thailand | 18.9 /100 | #205 | Poor 45.1% |
| German Russians | 18.9 /100 | #206 | Poor 45.1% |
Demographics Similar to Haitians by Associate's Degree
In terms of associate's degree, the demographic groups most similar to Haitians are Comanche (39.9%, a difference of 0.12%), Bangladeshi (40.0%, a difference of 0.15%), Immigrants from Belize (39.9%, a difference of 0.21%), Immigrants from Portugal (40.1%, a difference of 0.46%), and Immigrants from Caribbean (39.7%, a difference of 0.55%).
| Demographics | Rating | Rank | Associate's Degree |
| Puerto Ricans | 0.1 /100 | #276 | Tragic 40.4% |
| Blackfeet | 0.1 /100 | #277 | Tragic 40.3% |
| Ottawa | 0.1 /100 | #278 | Tragic 40.3% |
| Immigrants | Nicaragua | 0.1 /100 | #279 | Tragic 40.3% |
| Immigrants | Micronesia | 0.1 /100 | #280 | Tragic 40.2% |
| Immigrants | Portugal | 0.1 /100 | #281 | Tragic 40.1% |
| Bangladeshis | 0.1 /100 | #282 | Tragic 40.0% |
| Haitians | 0.1 /100 | #283 | Tragic 40.0% |
| Comanche | 0.1 /100 | #284 | Tragic 39.9% |
| Immigrants | Belize | 0.1 /100 | #285 | Tragic 39.9% |
| Immigrants | Caribbean | 0.0 /100 | #286 | Tragic 39.7% |
| Aleuts | 0.0 /100 | #287 | Tragic 39.6% |
| Immigrants | Cuba | 0.0 /100 | #288 | Tragic 39.5% |
| Central Americans | 0.0 /100 | #289 | Tragic 39.4% |
| Immigrants | Haiti | 0.0 /100 | #290 | Tragic 39.3% |