Central American Indian vs English 1st Grade
COMPARE
Central American Indian
English
1st Grade
1st Grade Comparison
Central American Indians
English
97.1%
1ST GRADE
0.0/ 100
METRIC RATING
297th/ 347
METRIC RANK
98.6%
1ST GRADE
100.0/ 100
METRIC RATING
14th/ 347
METRIC RANK
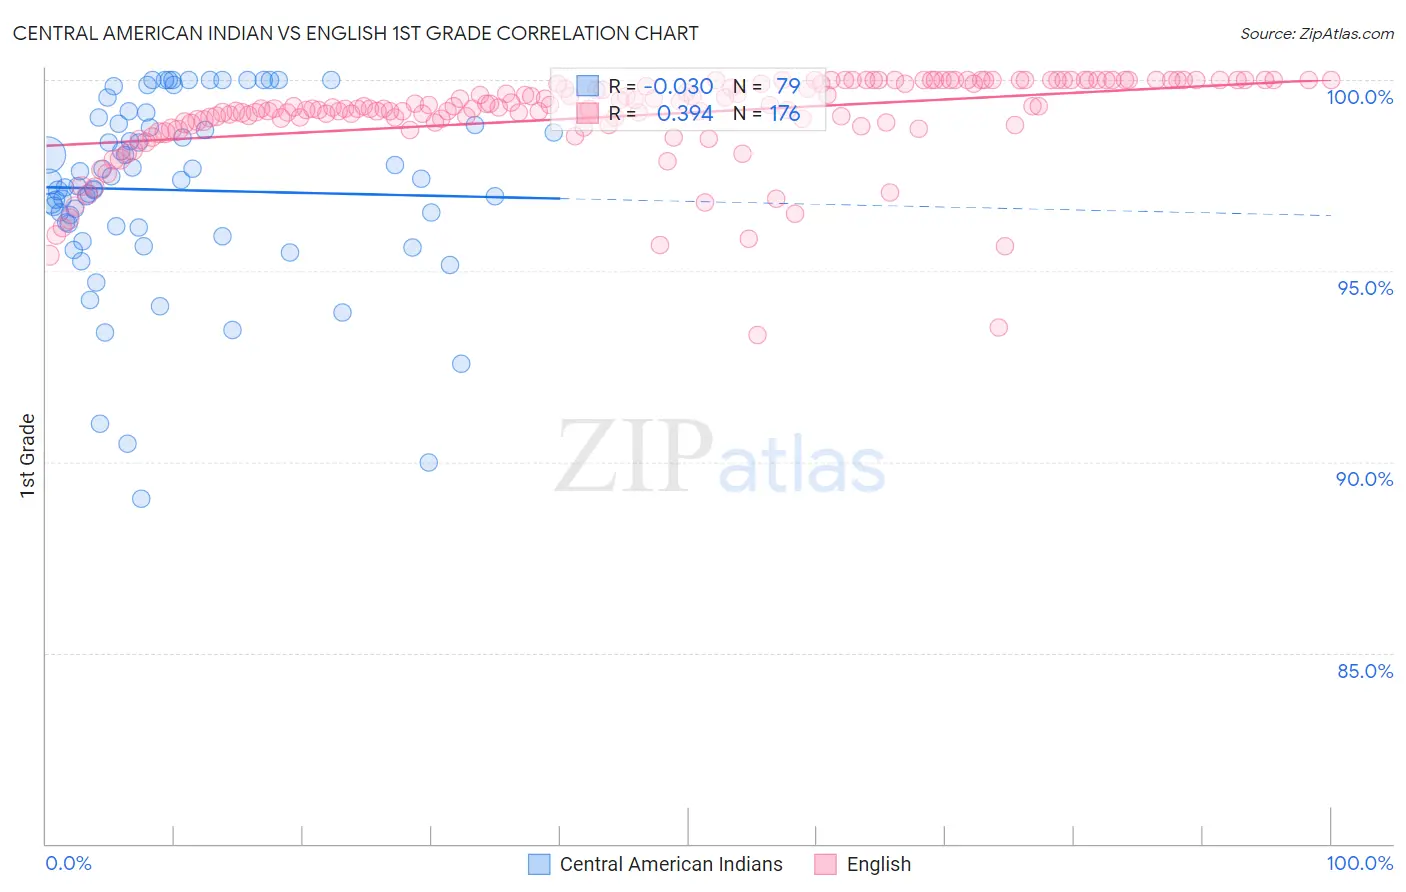
Central American Indian vs English 1st Grade Correlation Chart
The statistical analysis conducted on geographies consisting of 326,141,567 people shows no correlation between the proportion of Central American Indians and percentage of population with at least 1st grade education in the United States with a correlation coefficient (R) of -0.030 and weighted average of 97.1%. Similarly, the statistical analysis conducted on geographies consisting of 579,981,412 people shows a mild positive correlation between the proportion of English and percentage of population with at least 1st grade education in the United States with a correlation coefficient (R) of 0.394 and weighted average of 98.6%, a difference of 1.6%.
1st Grade Correlation Summary
| Measurement | Central American Indian | English |
| Minimum | 89.0% | 93.3% |
| Maximum | 100.0% | 100.0% |
| Range | 11.0% | 6.7% |
| Mean | 97.1% | 99.1% |
| Median | 97.3% | 99.3% |
| Interquartile 25% (IQ1) | 96.2% | 98.9% |
| Interquartile 75% (IQ3) | 98.9% | 100.0% |
| Interquartile Range (IQR) | 2.7% | 1.1% |
| Standard Deviation (Sample) | 2.5% | 1.2% |
| Standard Deviation (Population) | 2.4% | 1.2% |
Similar Demographics by 1st Grade
Demographics Similar to Central American Indians by 1st Grade
In terms of 1st grade, the demographic groups most similar to Central American Indians are Immigrants from Dominica (97.1%, a difference of 0.020%), Immigrants from Cuba (97.1%, a difference of 0.020%), Haitian (97.1%, a difference of 0.030%), Immigrants (97.2%, a difference of 0.050%), and Immigrants from Eritrea (97.2%, a difference of 0.050%).
| Demographics | Rating | Rank | 1st Grade |
| Immigrants | St. Vincent and the Grenadines | 0.0 /100 | #290 | Tragic 97.3% |
| Houma | 0.0 /100 | #291 | Tragic 97.2% |
| British West Indians | 0.0 /100 | #292 | Tragic 97.2% |
| Malaysians | 0.0 /100 | #293 | Tragic 97.2% |
| Immigrants | Grenada | 0.0 /100 | #294 | Tragic 97.2% |
| Immigrants | Immigrants | 0.0 /100 | #295 | Tragic 97.2% |
| Immigrants | Eritrea | 0.0 /100 | #296 | Tragic 97.2% |
| Central American Indians | 0.0 /100 | #297 | Tragic 97.1% |
| Immigrants | Dominica | 0.0 /100 | #298 | Tragic 97.1% |
| Immigrants | Cuba | 0.0 /100 | #299 | Tragic 97.1% |
| Haitians | 0.0 /100 | #300 | Tragic 97.1% |
| Immigrants | South Eastern Asia | 0.0 /100 | #301 | Tragic 97.1% |
| Immigrants | Caribbean | 0.0 /100 | #302 | Tragic 97.0% |
| Somalis | 0.0 /100 | #303 | Tragic 97.0% |
| Nicaraguans | 0.0 /100 | #304 | Tragic 97.0% |
Demographics Similar to English by 1st Grade
In terms of 1st grade, the demographic groups most similar to English are Carpatho Rusyn (98.6%, a difference of 0.0%), Slovene (98.7%, a difference of 0.010%), Swedish (98.6%, a difference of 0.010%), Tlingit-Haida (98.7%, a difference of 0.020%), and Aleut (98.6%, a difference of 0.030%).
| Demographics | Rating | Rank | 1st Grade |
| Alaska Natives | 100.0 /100 | #7 | Exceptional 98.7% |
| Norwegians | 100.0 /100 | #8 | Exceptional 98.7% |
| Slovaks | 100.0 /100 | #9 | Exceptional 98.7% |
| Germans | 100.0 /100 | #10 | Exceptional 98.7% |
| Tlingit-Haida | 100.0 /100 | #11 | Exceptional 98.7% |
| Slovenes | 100.0 /100 | #12 | Exceptional 98.7% |
| Carpatho Rusyns | 100.0 /100 | #13 | Exceptional 98.6% |
| English | 100.0 /100 | #14 | Exceptional 98.6% |
| Swedes | 100.0 /100 | #15 | Exceptional 98.6% |
| Aleuts | 100.0 /100 | #16 | Exceptional 98.6% |
| Scottish | 100.0 /100 | #17 | Exceptional 98.6% |
| Dutch | 100.0 /100 | #18 | Exceptional 98.6% |
| Irish | 100.0 /100 | #19 | Exceptional 98.6% |
| Sioux | 100.0 /100 | #20 | Exceptional 98.6% |
| Arapaho | 100.0 /100 | #21 | Exceptional 98.6% |