Celtic vs Immigrants from Dominica 1st Grade
COMPARE
Celtic
Immigrants from Dominica
1st Grade
1st Grade Comparison
Celtics
Immigrants from Dominica
98.4%
1ST GRADE
99.8/ 100
METRIC RATING
49th/ 347
METRIC RANK
97.1%
1ST GRADE
0.0/ 100
METRIC RATING
298th/ 347
METRIC RANK
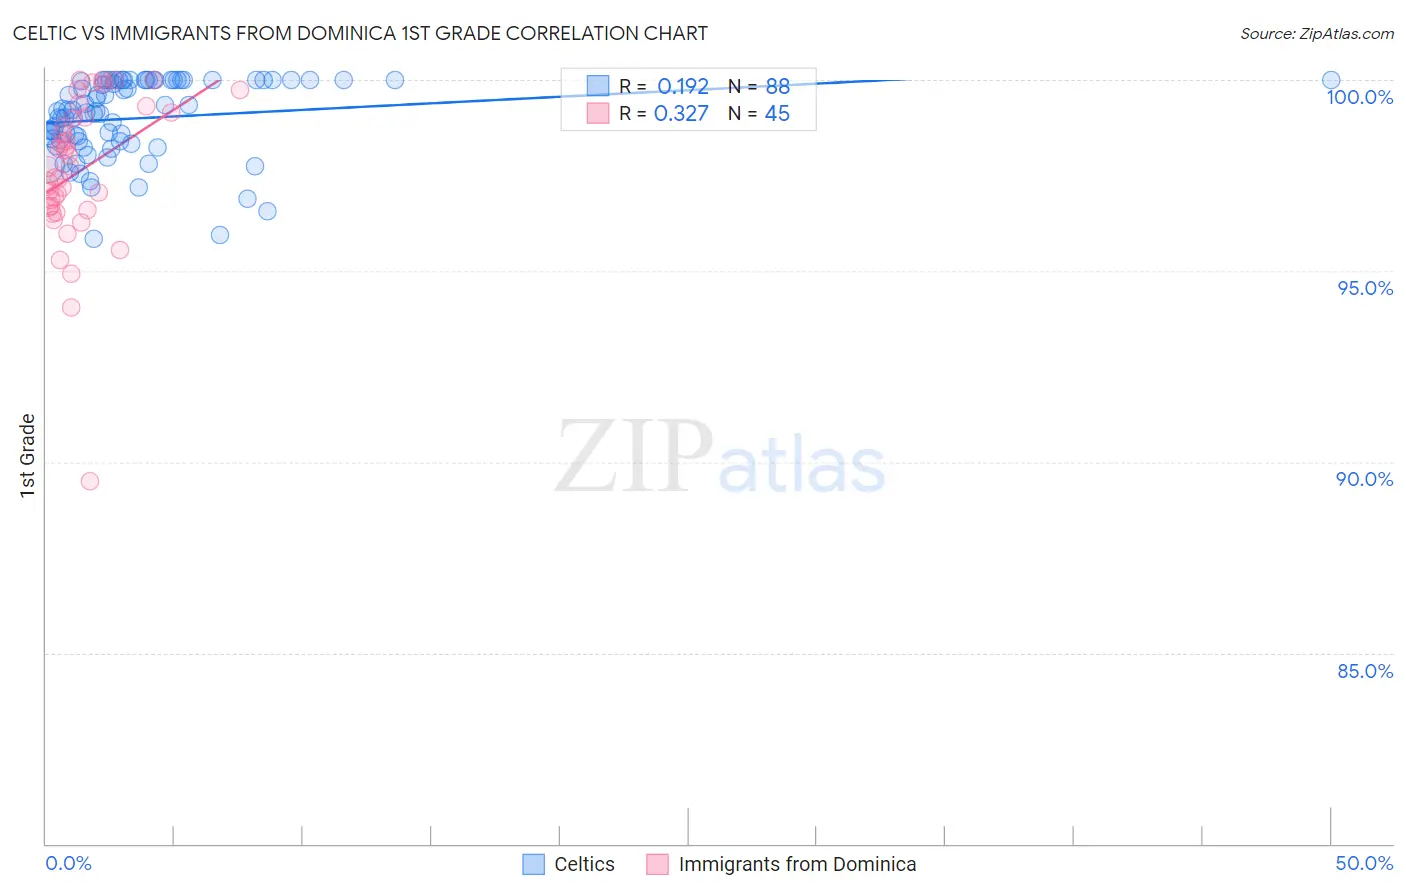
Celtic vs Immigrants from Dominica 1st Grade Correlation Chart
The statistical analysis conducted on geographies consisting of 168,875,705 people shows a poor positive correlation between the proportion of Celtics and percentage of population with at least 1st grade education in the United States with a correlation coefficient (R) of 0.192 and weighted average of 98.4%. Similarly, the statistical analysis conducted on geographies consisting of 83,794,115 people shows a mild positive correlation between the proportion of Immigrants from Dominica and percentage of population with at least 1st grade education in the United States with a correlation coefficient (R) of 0.327 and weighted average of 97.1%, a difference of 1.3%.
1st Grade Correlation Summary
| Measurement | Celtic | Immigrants from Dominica |
| Minimum | 95.8% | 89.5% |
| Maximum | 100.0% | 100.0% |
| Range | 4.2% | 10.5% |
| Mean | 99.0% | 97.6% |
| Median | 99.2% | 97.7% |
| Interquartile 25% (IQ1) | 98.4% | 96.6% |
| Interquartile 75% (IQ3) | 100.0% | 99.1% |
| Interquartile Range (IQR) | 1.6% | 2.4% |
| Standard Deviation (Sample) | 1.0% | 2.0% |
| Standard Deviation (Population) | 1.0% | 1.9% |
Similar Demographics by 1st Grade
Demographics Similar to Celtics by 1st Grade
In terms of 1st grade, the demographic groups most similar to Celtics are White/Caucasian (98.4%, a difference of 0.0%), Estonian (98.4%, a difference of 0.0%), Pueblo (98.4%, a difference of 0.0%), Kiowa (98.4%, a difference of 0.0%), and Ottawa (98.4%, a difference of 0.010%).
| Demographics | Rating | Rank | 1st Grade |
| Native Hawaiians | 99.9 /100 | #42 | Exceptional 98.5% |
| Lumbee | 99.9 /100 | #43 | Exceptional 98.5% |
| Northern Europeans | 99.9 /100 | #44 | Exceptional 98.5% |
| Belgians | 99.9 /100 | #45 | Exceptional 98.4% |
| Hungarians | 99.9 /100 | #46 | Exceptional 98.4% |
| Ottawa | 99.8 /100 | #47 | Exceptional 98.4% |
| Czechoslovakians | 99.8 /100 | #48 | Exceptional 98.4% |
| Celtics | 99.8 /100 | #49 | Exceptional 98.4% |
| Whites/Caucasians | 99.8 /100 | #50 | Exceptional 98.4% |
| Estonians | 99.8 /100 | #51 | Exceptional 98.4% |
| Pueblo | 99.8 /100 | #52 | Exceptional 98.4% |
| Kiowa | 99.8 /100 | #53 | Exceptional 98.4% |
| Australians | 99.8 /100 | #54 | Exceptional 98.4% |
| Immigrants | Scotland | 99.8 /100 | #55 | Exceptional 98.4% |
| Americans | 99.8 /100 | #56 | Exceptional 98.4% |
Demographics Similar to Immigrants from Dominica by 1st Grade
In terms of 1st grade, the demographic groups most similar to Immigrants from Dominica are Immigrants from Cuba (97.1%, a difference of 0.0%), Haitian (97.1%, a difference of 0.010%), Central American Indian (97.1%, a difference of 0.020%), Immigrants from South Eastern Asia (97.1%, a difference of 0.040%), and Immigrants from Caribbean (97.0%, a difference of 0.060%).
| Demographics | Rating | Rank | 1st Grade |
| Houma | 0.0 /100 | #291 | Tragic 97.2% |
| British West Indians | 0.0 /100 | #292 | Tragic 97.2% |
| Malaysians | 0.0 /100 | #293 | Tragic 97.2% |
| Immigrants | Grenada | 0.0 /100 | #294 | Tragic 97.2% |
| Immigrants | Immigrants | 0.0 /100 | #295 | Tragic 97.2% |
| Immigrants | Eritrea | 0.0 /100 | #296 | Tragic 97.2% |
| Central American Indians | 0.0 /100 | #297 | Tragic 97.1% |
| Immigrants | Dominica | 0.0 /100 | #298 | Tragic 97.1% |
| Immigrants | Cuba | 0.0 /100 | #299 | Tragic 97.1% |
| Haitians | 0.0 /100 | #300 | Tragic 97.1% |
| Immigrants | South Eastern Asia | 0.0 /100 | #301 | Tragic 97.1% |
| Immigrants | Caribbean | 0.0 /100 | #302 | Tragic 97.0% |
| Somalis | 0.0 /100 | #303 | Tragic 97.0% |
| Nicaraguans | 0.0 /100 | #304 | Tragic 97.0% |
| Ecuadorians | 0.0 /100 | #305 | Tragic 97.0% |