Immigrants from Malaysia vs Immigrants from France 4th Grade
COMPARE
Immigrants from Malaysia
Immigrants from France
4th Grade
4th Grade Comparison
Immigrants from Malaysia
Immigrants from France
97.2%
4TH GRADE
3.4/ 100
METRIC RATING
231st/ 347
METRIC RANK
97.8%
4TH GRADE
94.8/ 100
METRIC RATING
120th/ 347
METRIC RANK
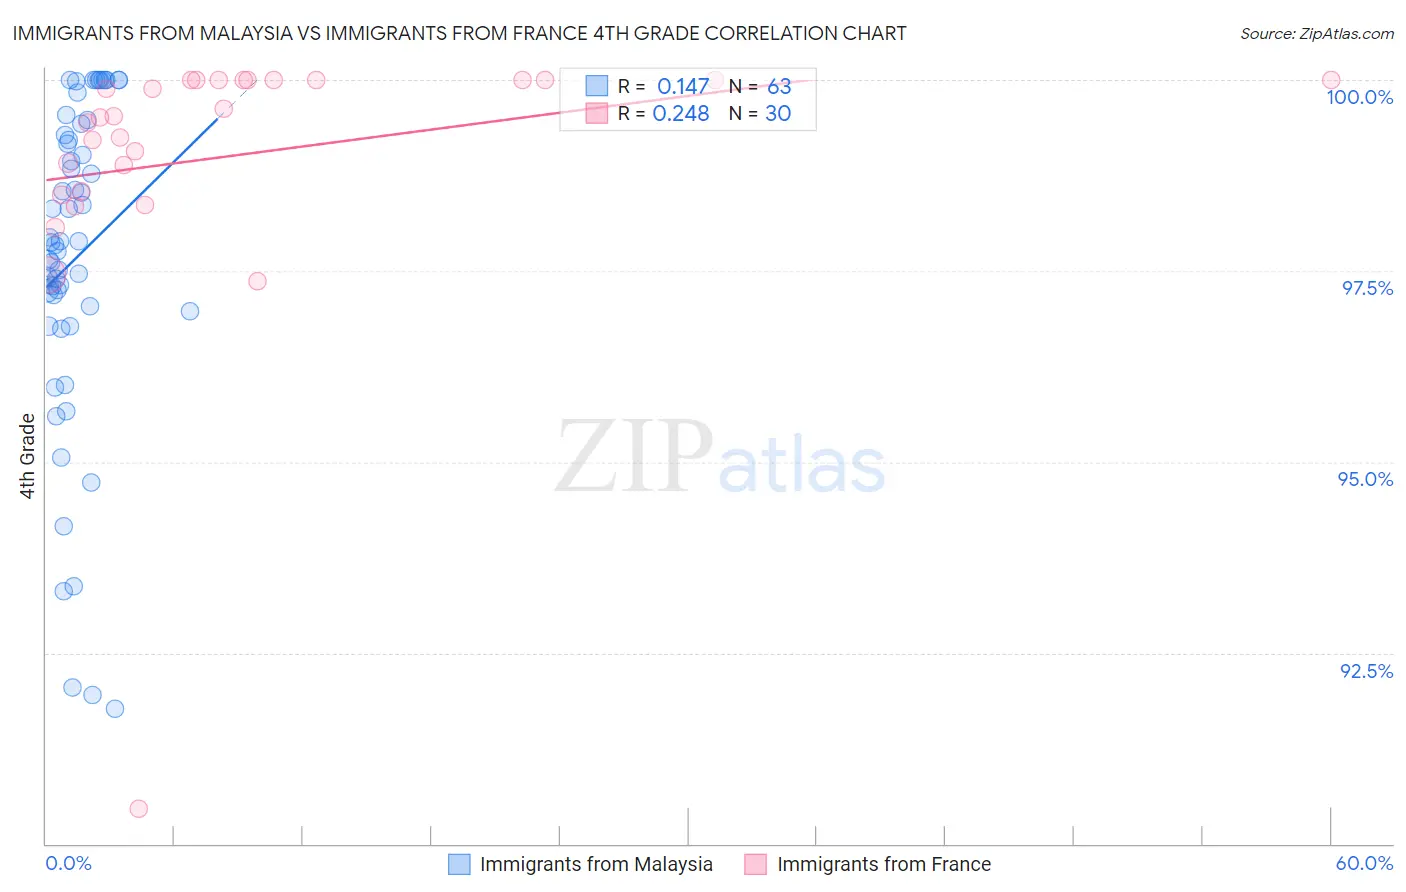
Immigrants from Malaysia vs Immigrants from France 4th Grade Correlation Chart
The statistical analysis conducted on geographies consisting of 197,973,709 people shows a poor positive correlation between the proportion of Immigrants from Malaysia and percentage of population with at least 4th grade education in the United States with a correlation coefficient (R) of 0.147 and weighted average of 97.2%. Similarly, the statistical analysis conducted on geographies consisting of 287,920,814 people shows a weak positive correlation between the proportion of Immigrants from France and percentage of population with at least 4th grade education in the United States with a correlation coefficient (R) of 0.248 and weighted average of 97.8%, a difference of 0.59%.
4th Grade Correlation Summary
| Measurement | Immigrants from Malaysia | Immigrants from France |
| Minimum | 91.8% | 90.5% |
| Maximum | 100.0% | 100.0% |
| Range | 8.2% | 9.5% |
| Mean | 97.6% | 99.0% |
| Median | 97.9% | 99.5% |
| Interquartile 25% (IQ1) | 97.0% | 98.5% |
| Interquartile 75% (IQ3) | 99.3% | 100.0% |
| Interquartile Range (IQR) | 2.3% | 1.5% |
| Standard Deviation (Sample) | 2.1% | 1.8% |
| Standard Deviation (Population) | 2.1% | 1.8% |
Similar Demographics by 4th Grade
Demographics Similar to Immigrants from Malaysia by 4th Grade
In terms of 4th grade, the demographic groups most similar to Immigrants from Malaysia are Uruguayan (97.2%, a difference of 0.0%), Immigrants from Western Asia (97.2%, a difference of 0.0%), Bahamian (97.2%, a difference of 0.010%), Immigrants from Pakistan (97.2%, a difference of 0.010%), and Subsaharan African (97.2%, a difference of 0.010%).
| Demographics | Rating | Rank | 4th Grade |
| Immigrants | Syria | 5.0 /100 | #224 | Tragic 97.2% |
| Immigrants | Iraq | 4.6 /100 | #225 | Tragic 97.2% |
| Bahamians | 3.8 /100 | #226 | Tragic 97.2% |
| Immigrants | Pakistan | 3.7 /100 | #227 | Tragic 97.2% |
| Sub-Saharan Africans | 3.6 /100 | #228 | Tragic 97.2% |
| Liberians | 3.6 /100 | #229 | Tragic 97.2% |
| Uruguayans | 3.5 /100 | #230 | Tragic 97.2% |
| Immigrants | Malaysia | 3.4 /100 | #231 | Tragic 97.2% |
| Immigrants | Western Asia | 3.4 /100 | #232 | Tragic 97.2% |
| Senegalese | 3.1 /100 | #233 | Tragic 97.2% |
| Assyrians/Chaldeans/Syriacs | 3.0 /100 | #234 | Tragic 97.2% |
| Yuman | 2.9 /100 | #235 | Tragic 97.2% |
| Immigrants | Eastern Asia | 2.7 /100 | #236 | Tragic 97.2% |
| Immigrants | Costa Rica | 2.0 /100 | #237 | Tragic 97.2% |
| Indians (Asian) | 1.9 /100 | #238 | Tragic 97.2% |
Demographics Similar to Immigrants from France by 4th Grade
In terms of 4th grade, the demographic groups most similar to Immigrants from France are Syrian (97.8%, a difference of 0.0%), Menominee (97.8%, a difference of 0.0%), Immigrants from Saudi Arabia (97.8%, a difference of 0.0%), Iroquois (97.8%, a difference of 0.010%), and Lebanese (97.8%, a difference of 0.010%).
| Demographics | Rating | Rank | 4th Grade |
| Basques | 95.8 /100 | #113 | Exceptional 97.8% |
| Iroquois | 95.4 /100 | #114 | Exceptional 97.8% |
| Lebanese | 95.4 /100 | #115 | Exceptional 97.8% |
| Immigrants | Croatia | 95.2 /100 | #116 | Exceptional 97.8% |
| Syrians | 94.9 /100 | #117 | Exceptional 97.8% |
| Menominee | 94.9 /100 | #118 | Exceptional 97.8% |
| Immigrants | Saudi Arabia | 94.8 /100 | #119 | Exceptional 97.8% |
| Immigrants | France | 94.8 /100 | #120 | Exceptional 97.8% |
| Immigrants | Norway | 94.2 /100 | #121 | Exceptional 97.8% |
| Immigrants | Japan | 94.1 /100 | #122 | Exceptional 97.8% |
| Immigrants | Zimbabwe | 93.9 /100 | #123 | Exceptional 97.8% |
| Spanish | 93.7 /100 | #124 | Exceptional 97.8% |
| Immigrants | Serbia | 92.6 /100 | #125 | Exceptional 97.8% |
| Immigrants | Europe | 92.5 /100 | #126 | Exceptional 97.8% |
| Colville | 92.3 /100 | #127 | Exceptional 97.7% |