Carpatho Rusyn vs U.S. Virgin Islander 1st Grade
COMPARE
Carpatho Rusyn
U.S. Virgin Islander
1st Grade
1st Grade Comparison
Carpatho Rusyns
U.S. Virgin Islanders
98.6%
1ST GRADE
100.0/ 100
METRIC RATING
13th/ 347
METRIC RANK
97.6%
1ST GRADE
1.9/ 100
METRIC RATING
237th/ 347
METRIC RANK
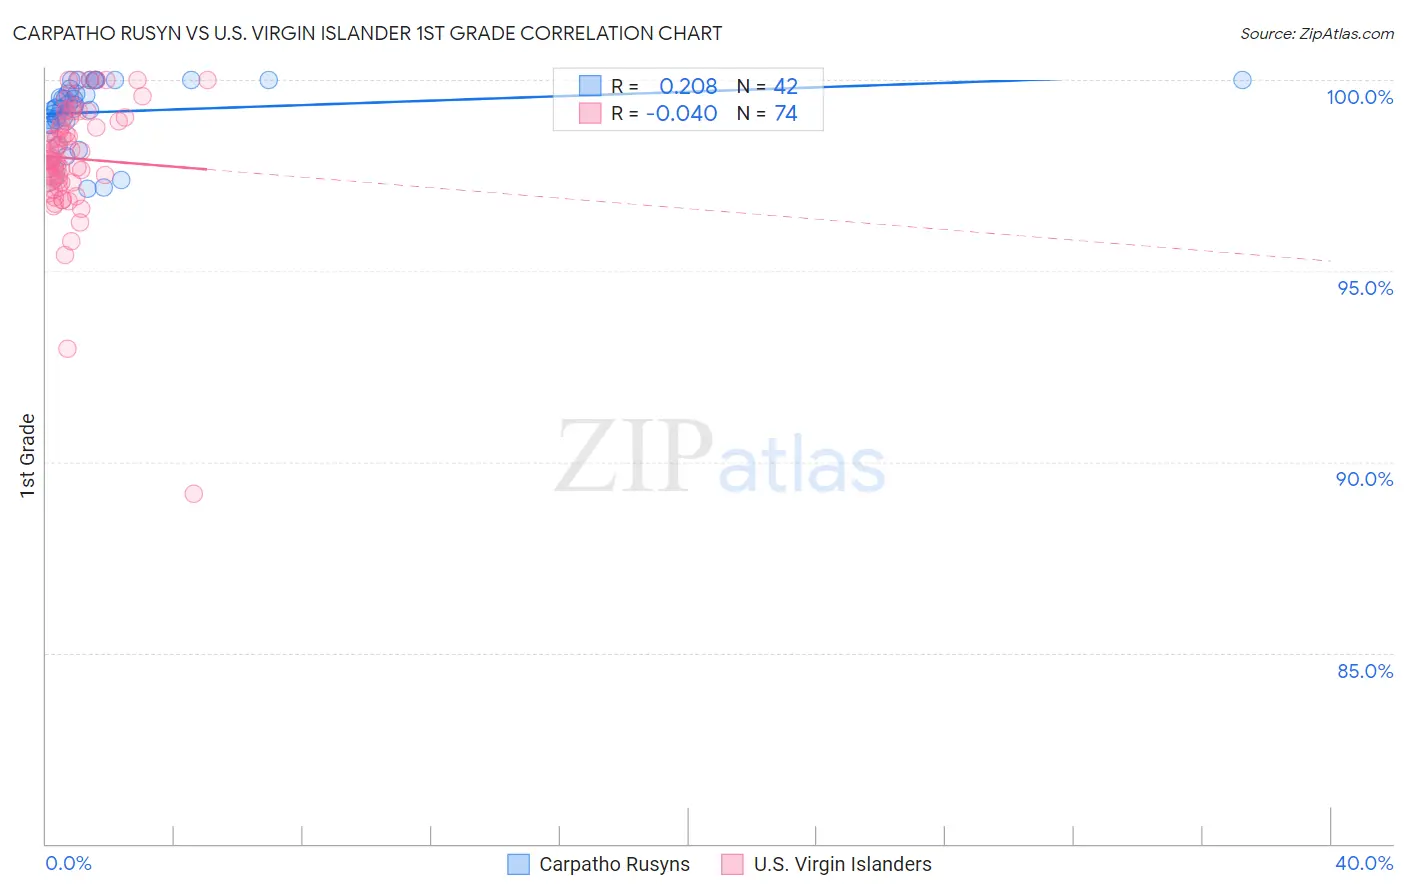
Carpatho Rusyn vs U.S. Virgin Islander 1st Grade Correlation Chart
The statistical analysis conducted on geographies consisting of 58,871,690 people shows a weak positive correlation between the proportion of Carpatho Rusyns and percentage of population with at least 1st grade education in the United States with a correlation coefficient (R) of 0.208 and weighted average of 98.6%. Similarly, the statistical analysis conducted on geographies consisting of 87,529,315 people shows no correlation between the proportion of U.S. Virgin Islanders and percentage of population with at least 1st grade education in the United States with a correlation coefficient (R) of -0.040 and weighted average of 97.6%, a difference of 1.1%.
1st Grade Correlation Summary
| Measurement | Carpatho Rusyn | U.S. Virgin Islander |
| Minimum | 97.2% | 89.2% |
| Maximum | 100.0% | 100.0% |
| Range | 2.8% | 10.8% |
| Mean | 99.2% | 97.9% |
| Median | 99.3% | 97.9% |
| Interquartile 25% (IQ1) | 98.9% | 97.4% |
| Interquartile 75% (IQ3) | 99.8% | 98.9% |
| Interquartile Range (IQR) | 0.86% | 1.5% |
| Standard Deviation (Sample) | 0.80% | 1.6% |
| Standard Deviation (Population) | 0.79% | 1.6% |
Similar Demographics by 1st Grade
Demographics Similar to Carpatho Rusyns by 1st Grade
In terms of 1st grade, the demographic groups most similar to Carpatho Rusyns are English (98.6%, a difference of 0.0%), Slovene (98.7%, a difference of 0.010%), Swedish (98.6%, a difference of 0.010%), Tlingit-Haida (98.7%, a difference of 0.020%), and Aleut (98.6%, a difference of 0.030%).
| Demographics | Rating | Rank | 1st Grade |
| Alaskan Athabascans | 100.0 /100 | #6 | Exceptional 98.8% |
| Alaska Natives | 100.0 /100 | #7 | Exceptional 98.7% |
| Norwegians | 100.0 /100 | #8 | Exceptional 98.7% |
| Slovaks | 100.0 /100 | #9 | Exceptional 98.7% |
| Germans | 100.0 /100 | #10 | Exceptional 98.7% |
| Tlingit-Haida | 100.0 /100 | #11 | Exceptional 98.7% |
| Slovenes | 100.0 /100 | #12 | Exceptional 98.7% |
| Carpatho Rusyns | 100.0 /100 | #13 | Exceptional 98.6% |
| English | 100.0 /100 | #14 | Exceptional 98.6% |
| Swedes | 100.0 /100 | #15 | Exceptional 98.6% |
| Aleuts | 100.0 /100 | #16 | Exceptional 98.6% |
| Scottish | 100.0 /100 | #17 | Exceptional 98.6% |
| Dutch | 100.0 /100 | #18 | Exceptional 98.6% |
| Irish | 100.0 /100 | #19 | Exceptional 98.6% |
| Sioux | 100.0 /100 | #20 | Exceptional 98.6% |
Demographics Similar to U.S. Virgin Islanders by 1st Grade
In terms of 1st grade, the demographic groups most similar to U.S. Virgin Islanders are Nigerian (97.6%, a difference of 0.0%), Immigrants from Pakistan (97.6%, a difference of 0.010%), Colombian (97.6%, a difference of 0.010%), Immigrants from Malaysia (97.6%, a difference of 0.010%), and Immigrants from Western Asia (97.6%, a difference of 0.010%).
| Demographics | Rating | Rank | 1st Grade |
| Senegalese | 3.5 /100 | #230 | Tragic 97.7% |
| Puerto Ricans | 3.0 /100 | #231 | Tragic 97.7% |
| Immigrants | Uruguay | 2.5 /100 | #232 | Tragic 97.6% |
| Immigrants | Pakistan | 2.2 /100 | #233 | Tragic 97.6% |
| Colombians | 2.2 /100 | #234 | Tragic 97.6% |
| Immigrants | Malaysia | 2.1 /100 | #235 | Tragic 97.6% |
| Immigrants | Western Asia | 2.1 /100 | #236 | Tragic 97.6% |
| U.S. Virgin Islanders | 1.9 /100 | #237 | Tragic 97.6% |
| Nigerians | 1.8 /100 | #238 | Tragic 97.6% |
| Immigrants | Eastern Asia | 1.6 /100 | #239 | Tragic 97.6% |
| Koreans | 1.5 /100 | #240 | Tragic 97.6% |
| Liberians | 1.4 /100 | #241 | Tragic 97.6% |
| Immigrants | Indonesia | 1.2 /100 | #242 | Tragic 97.6% |
| Bolivians | 1.2 /100 | #243 | Tragic 97.6% |
| Asians | 1.1 /100 | #244 | Tragic 97.6% |