Cajun vs Cape Verdean 11th Grade

COMPARE

Cajun
Race
Ancestry
AfghanAfricanAlaska NativeAlaskan AthabascanAlbanianAleutAlsatianAmericanApacheArabArapahoArgentineanArmenianAssyrian/Chaldean/SyriacAustralianAustrianBahamianBangladeshiBarbadianBasqueBelgianBelizeanBermudanBhutaneseBlackfeetBolivianBrazilianBritishBritish West IndianBulgarianBurmeseCajunCambodianCanadianCarpatho RusynCelticCentral AmericanCentral American IndianCherokeeCheyenneChickasawChileanChineseChippewaChoctawColombianColvilleComancheCosta RicanCreeCreekCroatianCrowCubanCypriotCzechCzechoslovakianDanishDelawareDominicanDutchDutch West IndianEastern EuropeanEcuadorianEgyptianEnglishEstonianEthiopianEuropeanFijianFilipinoFinnishFrenchFrench American IndianFrench CanadianGermanGerman RussianGhanaianGreekGuamanian/ChamorroGuatemalanGuyaneseHaitianHmongHonduranHopiHoumaHungarianIcelanderIndian (Asian)IndonesianInupiatIranianIraqiIrishIroquoisIsraeliItalianJamaicanJapaneseJordanianKenyanKiowaKoreanLaotianLatvianLebaneseLiberianLithuanianLumbeeLuxembourgerMacedonianMalaysianMalteseMarshalleseMenomineeMexicanMexican American IndianMongolianMoroccanNative HawaiianNavajoNepaleseNew ZealanderNicaraguanNigerianNorthern EuropeanNorwegianOkinawanOsageOttawaPaiutePakistaniPalestinianPanamanianParaguayanPennsylvania GermanPeruvianPimaPolishPortuguesePotawatomiPuebloPuerto RicanPuget Sound SalishRomanianRussianSalvadoranSamoanScandinavianScotch-IrishScottishSeminoleSenegaleseSerbianShoshoneSierra LeoneanSiouxSlavicSlovakSloveneSomaliSouth AfricanSouth AmericanSouth American IndianSoviet UnionSpaniardSpanishSpanish AmericanSpanish American IndianSri LankanSubsaharan AfricanSudaneseSwedishSwissSyrianTaiwaneseThaiTlingit-HaidaTohono O'OdhamTonganTrinidadian and TobagonianTsimshianTurkishU.S. Virgin IslanderUgandanUkrainianUruguayanUteVenezuelanVietnameseWelshWest IndianYakamaYaquiYugoslavianYumanYup'ikZimbabwean
Immigration
NonimmigrantsImmigrantsAfghanistanAfricaAlbaniaArgentinaArmeniaAsiaAustraliaAustriaBahamasBangladeshBarbadosBelarusBelgiumBelizeBoliviaBosnia and HerzegovinaBrazilBulgariaBurma/MyanmarCabo VerdeCambodiaCameroonCanadaCaribbeanCentral AmericaChileChinaColombiaCongoCosta RicaCroatiaCubaCzechoslovakiaDenmarkDominicaDominican RepublicEastern AfricaEastern AsiaEastern EuropeEcuadorEgyptEl SalvadorEnglandEritreaEthiopiaEuropeFijiFranceGermanyGhanaGreeceGrenadaGuatemalaGuyanaHaitiHondurasHong KongHungaryIndiaIndonesiaIranIraqIrelandIsraelItalyJamaicaJapanJordanKazakhstanKenyaKoreaKuwaitLaosLatin AmericaLatviaLebanonLiberiaLithuaniaMalaysiaMexicoMicronesiaMiddle AfricaMoldovaMoroccoNepalNetherlandsNicaraguaNigeriaNorth AmericaNorth MacedoniaNorthern AfricaNorthern EuropeNorwayOceaniaPakistanPanamaPeruPhilippinesPolandPortugalRomaniaRussiaSaudi ArabiaScotlandSenegalSerbiaSierra LeoneSingaporeSomaliaSouth AfricaSouth AmericaSouth Central AsiaSouth Eastern AsiaSouthern EuropeSpainSri LankaSt. Vincent and the GrenadinesSudanSwedenSwitzerlandSyriaTaiwanThailandTrinidad and TobagoTurkeyUgandaUkraineUruguayUzbekistanVenezuelaVietnamWest IndiesWestern AfricaWestern AsiaWestern EuropeYemenZaireZimbabweAzores
Cape Verdean
Race
Ancestry
AfghanAfricanAlaska NativeAlaskan AthabascanAlbanianAleutAlsatianAmericanApacheArabArapahoArgentineanArmenianAssyrian/Chaldean/SyriacAustralianAustrianBahamianBangladeshiBarbadianBasqueBelgianBelizeanBermudanBhutaneseBlackfeetBolivianBrazilianBritishBritish West IndianBulgarianBurmeseCambodianCanadianCape VerdeanCarpatho RusynCelticCentral AmericanCentral American IndianCherokeeCheyenneChickasawChileanChineseChippewaChoctawColombianColvilleComancheCosta RicanCreeCreekCroatianCrowCubanCypriotCzechCzechoslovakianDanishDelawareDominicanDutchDutch West IndianEastern EuropeanEcuadorianEgyptianEnglishEstonianEthiopianEuropeanFijianFilipinoFinnishFrenchFrench American IndianFrench CanadianGermanGerman RussianGhanaianGreekGuamanian/ChamorroGuatemalanGuyaneseHaitianHmongHonduranHopiHoumaHungarianIcelanderIndian (Asian)IndonesianInupiatIranianIraqiIrishIroquoisIsraeliItalianJamaicanJapaneseJordanianKenyanKiowaKoreanLaotianLatvianLebaneseLiberianLithuanianLumbeeLuxembourgerMacedonianMalaysianMalteseMarshalleseMenomineeMexicanMexican American IndianMongolianMoroccanNative HawaiianNavajoNepaleseNew ZealanderNicaraguanNigerianNorthern EuropeanNorwegianOkinawanOsageOttawaPaiutePakistaniPalestinianPanamanianParaguayanPennsylvania GermanPeruvianPimaPolishPortuguesePotawatomiPuebloPuerto RicanPuget Sound SalishRomanianRussianSalvadoranSamoanScandinavianScotch-IrishScottishSeminoleSenegaleseSerbianShoshoneSierra LeoneanSiouxSlavicSlovakSloveneSomaliSouth AfricanSouth AmericanSouth American IndianSoviet UnionSpaniardSpanishSpanish AmericanSpanish American IndianSri LankanSubsaharan AfricanSudaneseSwedishSwissSyrianTaiwaneseThaiTlingit-HaidaTohono O'OdhamTonganTrinidadian and TobagonianTsimshianTurkishU.S. Virgin IslanderUgandanUkrainianUruguayanUteVenezuelanVietnameseWelshWest IndianYakamaYaquiYugoslavianYumanYup'ikZimbabwean
Immigration
NonimmigrantsImmigrantsAfghanistanAfricaAlbaniaArgentinaArmeniaAsiaAustraliaAustriaBahamasBangladeshBarbadosBelarusBelgiumBelizeBoliviaBosnia and HerzegovinaBrazilBulgariaBurma/MyanmarCabo VerdeCambodiaCameroonCanadaCaribbeanCentral AmericaChileChinaColombiaCongoCosta RicaCroatiaCubaCzechoslovakiaDenmarkDominicaDominican RepublicEastern AfricaEastern AsiaEastern EuropeEcuadorEgyptEl SalvadorEnglandEritreaEthiopiaEuropeFijiFranceGermanyGhanaGreeceGrenadaGuatemalaGuyanaHaitiHondurasHong KongHungaryIndiaIndonesiaIranIraqIrelandIsraelItalyJamaicaJapanJordanKazakhstanKenyaKoreaKuwaitLaosLatin AmericaLatviaLebanonLiberiaLithuaniaMalaysiaMexicoMicronesiaMiddle AfricaMoldovaMoroccoNepalNetherlandsNicaraguaNigeriaNorth AmericaNorth MacedoniaNorthern AfricaNorthern EuropeNorwayOceaniaPakistanPanamaPeruPhilippinesPolandPortugalRomaniaRussiaSaudi ArabiaScotlandSenegalSerbiaSierra LeoneSingaporeSomaliaSouth AfricaSouth AmericaSouth Central AsiaSouth Eastern AsiaSouthern EuropeSpainSri LankaSt. Vincent and the GrenadinesSudanSwedenSwitzerlandSyriaTaiwanThailandTrinidad and TobagoTurkeyUgandaUkraineUruguayUzbekistanVenezuelaVietnamWest IndiesWestern AfricaWestern AsiaWestern EuropeYemenZaireZimbabweAzores
11th Grade
Income
Poverty
Unemployment
Labor Participation
Family Structure
Vehicle Availability
Education Level
Disability

11th Grade Comparison

Cajuns

Cape Verdeans

Tragic
Tragic
91.4%
11TH GRADE
0.7/ 100
METRIC RATING
257th/ 347
METRIC RANK
89.1%
11TH GRADE
0.0/ 100
METRIC RATING
314th/ 347
METRIC RANK

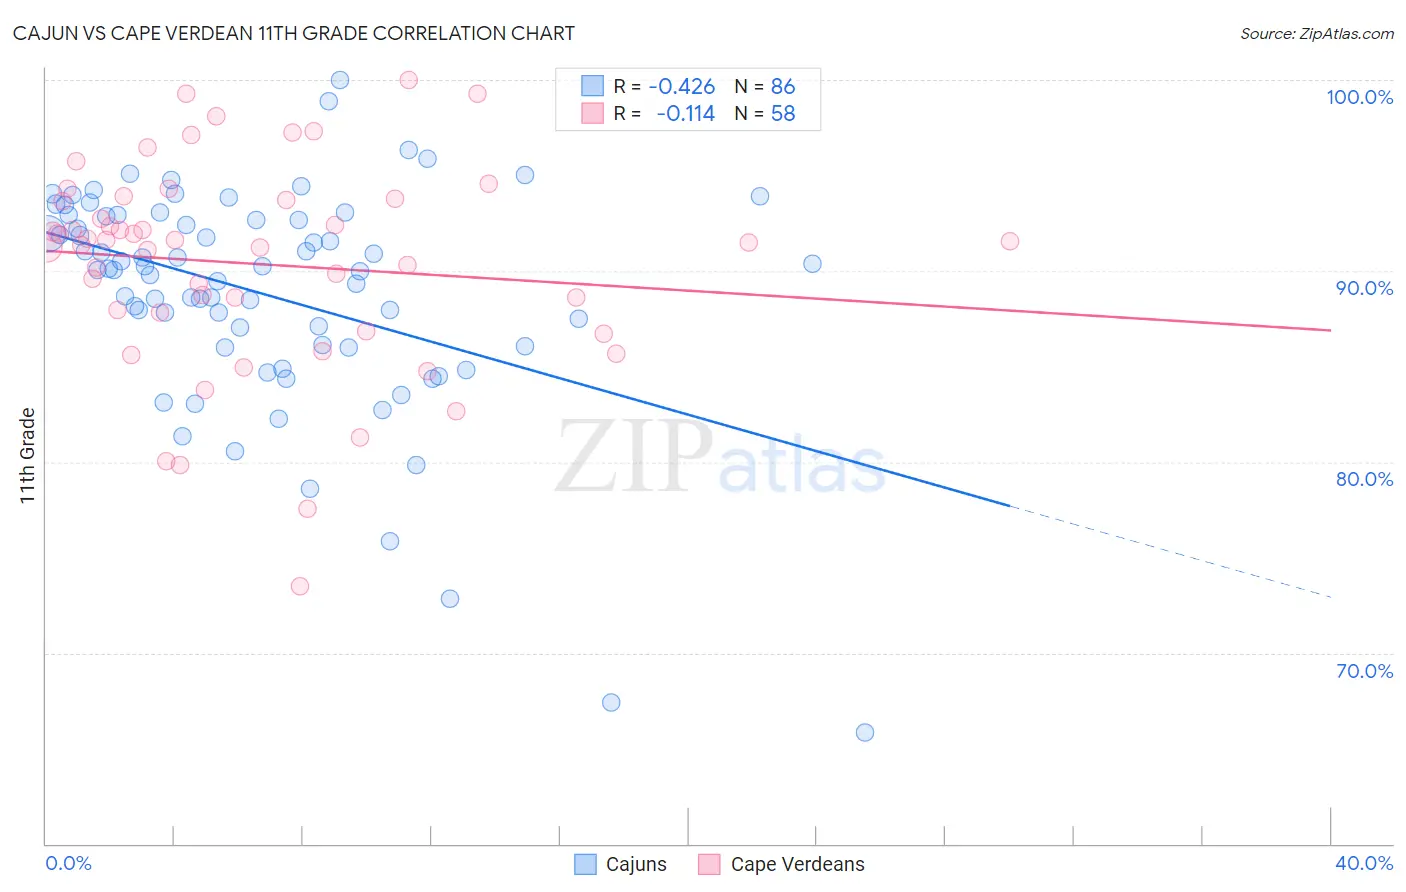
Cajun vs Cape Verdean 11th Grade Correlation Chart

The statistical analysis conducted on geographies consisting of 149,713,149 people shows a moderate negative correlation between the proportion of Cajuns and percentage of population with at least 11th grade education in the United States with a correlation coefficient (R) of -0.426 and weighted average of 91.4%. Similarly, the statistical analysis conducted on geographies consisting of 107,537,955 people shows a poor negative correlation between the proportion of Cape Verdeans and percentage of population with at least 11th grade education in the United States with a correlation coefficient (R) of -0.114 and weighted average of 89.1%, a difference of 2.6%.
Cajun vs Cape Verdean 11th Grade

11th Grade Correlation Summary

MeasurementCajunCape Verdean
Minimum65.8%73.5%
Maximum100.0%100.0%
Range34.2%26.5%
Mean88.8%90.4%
Median90.1%91.5%
Interquartile 25% (IQ1)86.0%87.8%
Interquartile 75% (IQ3)92.9%93.7%
Interquartile Range (IQR)6.8%5.9%
Standard Deviation (Sample)5.9%5.4%
Standard Deviation (Population)5.9%5.4%

Similar Demographics by 11th Grade

Demographics Similar to Cajuns by 11th Grade

In terms of 11th grade, the demographic groups most similar to Cajuns are Black/African American (91.4%, a difference of 0.010%), Immigrants from Senegal (91.4%, a difference of 0.010%), Immigrants from Eritrea (91.4%, a difference of 0.020%), Immigrants from Colombia (91.4%, a difference of 0.020%), and Jamaican (91.4%, a difference of 0.030%).
DemographicsRating | Rank11th Grade
Ghanaians
0.9
/100
|
#250
Tragic
91.5%
Immigrants | Costa Rica
0.9
/100
|
#251
Tragic
91.4%
Immigrants | Nigeria
0.8
/100
|
#252
Tragic
91.4%
Immigrants | South America
0.8
/100
|
#253
Tragic
91.4%
Immigrants | Eritrea
0.7
/100
|
#254
Tragic
91.4%
Blacks/African Americans
0.7
/100
|
#255
Tragic
91.4%
Immigrants | Senegal
0.7
/100
|
#256
Tragic
91.4%
Cajuns
0.7
/100
|
#257
Tragic
91.4%
Immigrants | Colombia
0.6
/100
|
#258
Tragic
91.4%
Jamaicans
0.6
/100
|
#259
Tragic
91.4%
Spanish Americans
0.6
/100
|
#260
Tragic
91.4%
Taiwanese
0.6
/100
|
#261
Tragic
91.3%
Immigrants | Uruguay
0.5
/100
|
#262
Tragic
91.3%
Immigrants | Ghana
0.3
/100
|
#263
Tragic
91.2%
Yup'ik
0.3
/100
|
#264
Tragic
91.2%

Demographics Similar to Cape Verdeans by 11th Grade

In terms of 11th grade, the demographic groups most similar to Cape Verdeans are Immigrants from Ecuador (89.1%, a difference of 0.010%), Immigrants from Caribbean (89.1%, a difference of 0.020%), Immigrants from Cuba (88.9%, a difference of 0.16%), Lumbee (88.9%, a difference of 0.17%), and Immigrants from Portugal (89.3%, a difference of 0.22%).
DemographicsRating | Rank11th Grade
Immigrants | Dominica
0.0
/100
|
#307
Tragic
89.5%
Nepalese
0.0
/100
|
#308
Tragic
89.5%
Immigrants | Bangladesh
0.0
/100
|
#309
Tragic
89.5%
Yaqui
0.0
/100
|
#310
Tragic
89.5%
Vietnamese
0.0
/100
|
#311
Tragic
89.4%
Immigrants | Portugal
0.0
/100
|
#312
Tragic
89.3%
Immigrants | Caribbean
0.0
/100
|
#313
Tragic
89.1%
Cape Verdeans
0.0
/100
|
#314
Tragic
89.1%
Immigrants | Ecuador
0.0
/100
|
#315
Tragic
89.1%
Immigrants | Cuba
0.0
/100
|
#316
Tragic
88.9%
Lumbee
0.0
/100
|
#317
Tragic
88.9%
Nicaraguans
0.0
/100
|
#318
Tragic
88.9%
Belizeans
0.0
/100
|
#319
Tragic
88.8%
Immigrants | Armenia
0.0
/100
|
#320
Tragic
88.8%
Immigrants | Belize
0.0
/100
|
#321
Tragic
88.7%