Cajun vs Immigrants from Guyana 4th Grade
COMPARE
Cajun
Immigrants from Guyana
4th Grade
4th Grade Comparison
Cajuns
Immigrants from Guyana
98.0%
4TH GRADE
99.7/ 100
METRIC RATING
64th/ 347
METRIC RANK
96.3%
4TH GRADE
0.0/ 100
METRIC RATING
309th/ 347
METRIC RANK
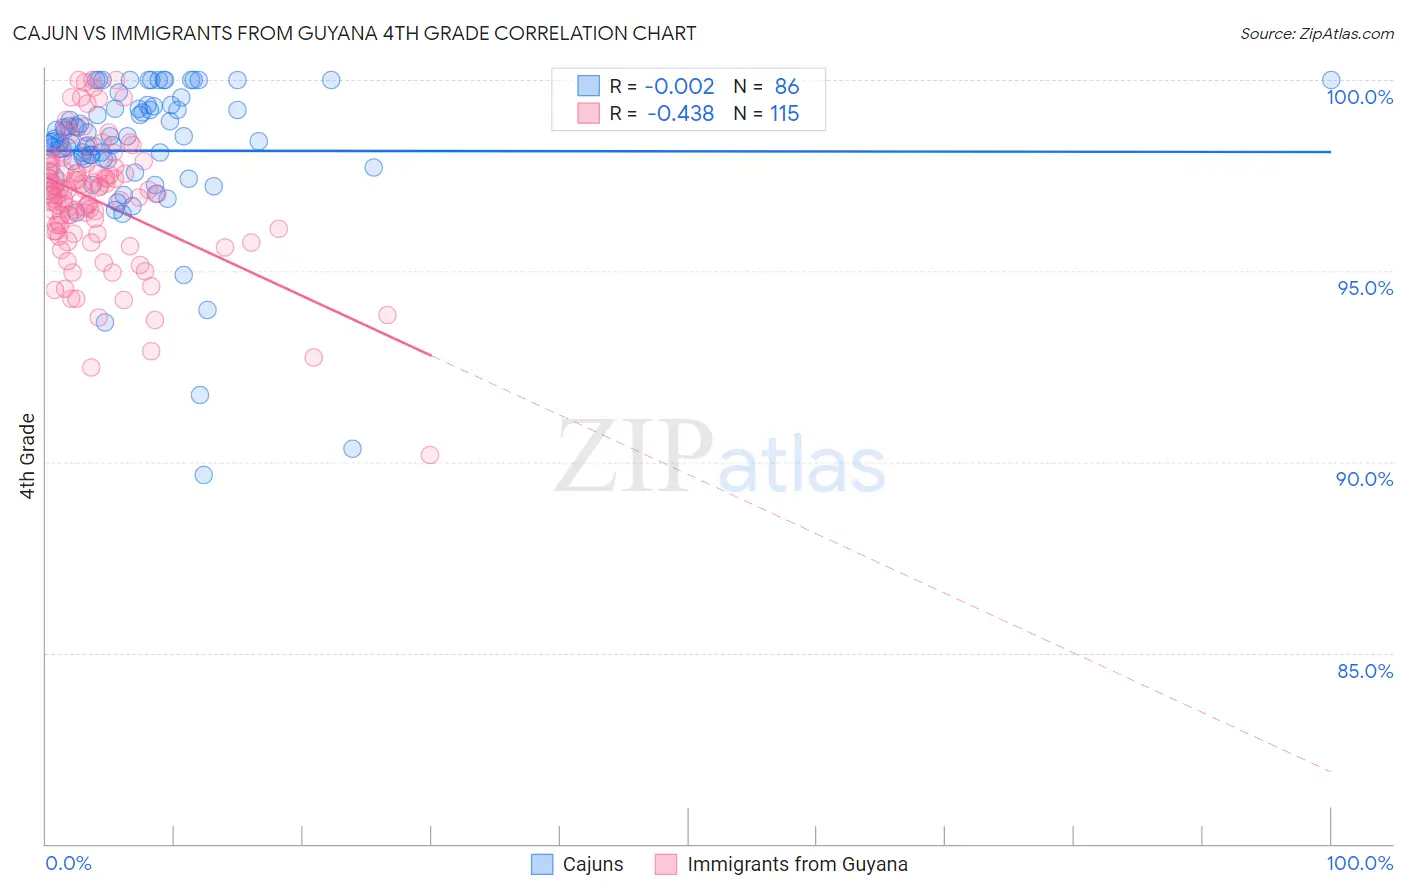
Cajun vs Immigrants from Guyana 4th Grade Correlation Chart
The statistical analysis conducted on geographies consisting of 149,712,957 people shows no correlation between the proportion of Cajuns and percentage of population with at least 4th grade education in the United States with a correlation coefficient (R) of -0.002 and weighted average of 98.0%. Similarly, the statistical analysis conducted on geographies consisting of 183,673,461 people shows a moderate negative correlation between the proportion of Immigrants from Guyana and percentage of population with at least 4th grade education in the United States with a correlation coefficient (R) of -0.438 and weighted average of 96.3%, a difference of 1.8%.
4th Grade Correlation Summary
| Measurement | Cajun | Immigrants from Guyana |
| Minimum | 89.7% | 90.2% |
| Maximum | 100.0% | 100.0% |
| Range | 10.3% | 9.8% |
| Mean | 98.1% | 96.8% |
| Median | 98.4% | 97.0% |
| Interquartile 25% (IQ1) | 97.9% | 96.0% |
| Interquartile 75% (IQ3) | 99.2% | 97.7% |
| Interquartile Range (IQR) | 1.4% | 1.7% |
| Standard Deviation (Sample) | 1.9% | 1.7% |
| Standard Deviation (Population) | 1.9% | 1.7% |
Similar Demographics by 4th Grade
Demographics Similar to Cajuns by 4th Grade
In terms of 4th grade, the demographic groups most similar to Cajuns are Immigrants from Northern Europe (98.0%, a difference of 0.0%), Serbian (98.1%, a difference of 0.010%), Russian (98.0%, a difference of 0.010%), Canadian (98.0%, a difference of 0.010%), and New Zealander (98.0%, a difference of 0.010%).
| Demographics | Rating | Rank | 4th Grade |
| Austrians | 99.8 /100 | #57 | Exceptional 98.1% |
| Creek | 99.8 /100 | #58 | Exceptional 98.1% |
| Americans | 99.8 /100 | #59 | Exceptional 98.1% |
| Immigrants | Canada | 99.7 /100 | #60 | Exceptional 98.1% |
| Immigrants | North America | 99.7 /100 | #61 | Exceptional 98.1% |
| Serbians | 99.7 /100 | #62 | Exceptional 98.1% |
| Russians | 99.7 /100 | #63 | Exceptional 98.0% |
| Cajuns | 99.7 /100 | #64 | Exceptional 98.0% |
| Immigrants | Northern Europe | 99.6 /100 | #65 | Exceptional 98.0% |
| Canadians | 99.6 /100 | #66 | Exceptional 98.0% |
| New Zealanders | 99.6 /100 | #67 | Exceptional 98.0% |
| Kiowa | 99.6 /100 | #68 | Exceptional 98.0% |
| Pueblo | 99.6 /100 | #69 | Exceptional 98.0% |
| Immigrants | Austria | 99.6 /100 | #70 | Exceptional 98.0% |
| Lumbee | 99.6 /100 | #71 | Exceptional 98.0% |
Demographics Similar to Immigrants from Guyana by 4th Grade
In terms of 4th grade, the demographic groups most similar to Immigrants from Guyana are Immigrants from Laos (96.3%, a difference of 0.0%), Immigrants from Haiti (96.3%, a difference of 0.010%), Immigrants from Burma/Myanmar (96.3%, a difference of 0.020%), Sri Lankan (96.4%, a difference of 0.040%), and Immigrants from Caribbean (96.4%, a difference of 0.050%).
| Demographics | Rating | Rank | 4th Grade |
| Immigrants | Cuba | 0.0 /100 | #302 | Tragic 96.4% |
| Guyanese | 0.0 /100 | #303 | Tragic 96.4% |
| Ecuadorians | 0.0 /100 | #304 | Tragic 96.4% |
| Immigrants | Caribbean | 0.0 /100 | #305 | Tragic 96.4% |
| Sri Lankans | 0.0 /100 | #306 | Tragic 96.4% |
| Immigrants | Haiti | 0.0 /100 | #307 | Tragic 96.3% |
| Immigrants | Laos | 0.0 /100 | #308 | Tragic 96.3% |
| Immigrants | Guyana | 0.0 /100 | #309 | Tragic 96.3% |
| Immigrants | Burma/Myanmar | 0.0 /100 | #310 | Tragic 96.3% |
| Immigrants | Bangladesh | 0.0 /100 | #311 | Tragic 96.2% |
| Cape Verdeans | 0.0 /100 | #312 | Tragic 96.2% |
| Indonesians | 0.0 /100 | #313 | Tragic 96.2% |
| Vietnamese | 0.0 /100 | #314 | Tragic 96.2% |
| Nicaraguans | 0.0 /100 | #315 | Tragic 96.2% |
| Immigrants | Ecuador | 0.0 /100 | #316 | Tragic 96.2% |