Cajun vs Czechoslovakian 4th Grade
COMPARE
Cajun
Czechoslovakian
4th Grade
4th Grade Comparison
Cajuns
Czechoslovakians
98.0%
4TH GRADE
99.7/ 100
METRIC RATING
64th/ 347
METRIC RANK
98.1%
4TH GRADE
99.9/ 100
METRIC RATING
45th/ 347
METRIC RANK
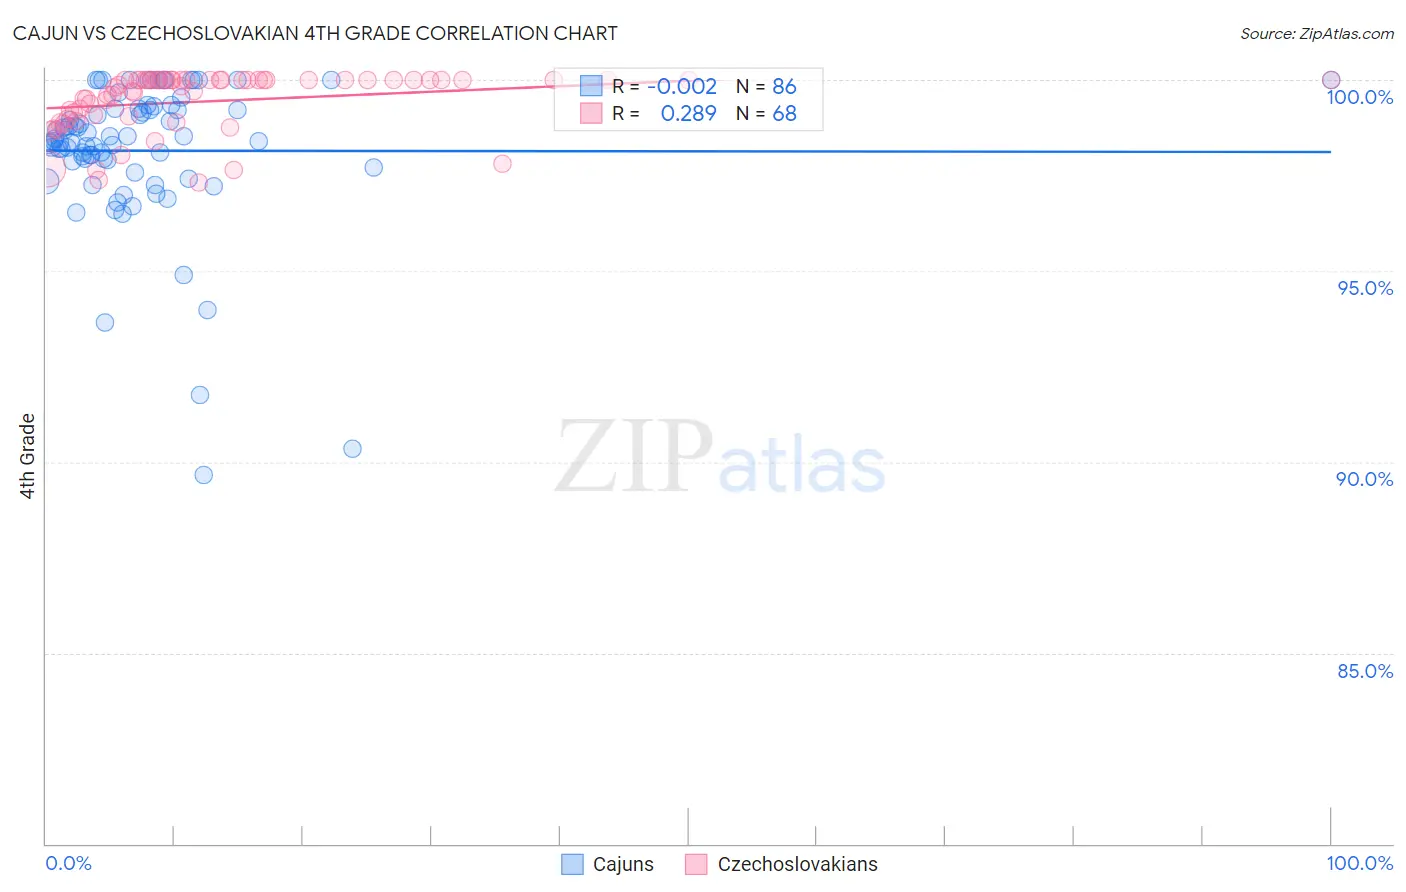
Cajun vs Czechoslovakian 4th Grade Correlation Chart
The statistical analysis conducted on geographies consisting of 149,712,957 people shows no correlation between the proportion of Cajuns and percentage of population with at least 4th grade education in the United States with a correlation coefficient (R) of -0.002 and weighted average of 98.0%. Similarly, the statistical analysis conducted on geographies consisting of 368,657,544 people shows a weak positive correlation between the proportion of Czechoslovakians and percentage of population with at least 4th grade education in the United States with a correlation coefficient (R) of 0.289 and weighted average of 98.1%, a difference of 0.090%.
4th Grade Correlation Summary
| Measurement | Cajun | Czechoslovakian |
| Minimum | 89.7% | 97.3% |
| Maximum | 100.0% | 100.0% |
| Range | 10.3% | 2.7% |
| Mean | 98.1% | 99.5% |
| Median | 98.4% | 99.9% |
| Interquartile 25% (IQ1) | 97.9% | 99.0% |
| Interquartile 75% (IQ3) | 99.2% | 100.0% |
| Interquartile Range (IQR) | 1.4% | 0.99% |
| Standard Deviation (Sample) | 1.9% | 0.77% |
| Standard Deviation (Population) | 1.9% | 0.76% |
Demographics Similar to Cajuns and Czechoslovakians by 4th Grade
In terms of 4th grade, the demographic groups most similar to Cajuns are Serbian (98.1%, a difference of 0.010%), Russian (98.0%, a difference of 0.010%), Immigrants from Canada (98.1%, a difference of 0.020%), Immigrants from North America (98.1%, a difference of 0.020%), and American (98.1%, a difference of 0.030%). Similarly, the demographic groups most similar to Czechoslovakians are Ottawa (98.1%, a difference of 0.0%), Arapaho (98.1%, a difference of 0.0%), Native Hawaiian (98.1%, a difference of 0.010%), Estonian (98.1%, a difference of 0.020%), and Bulgarian (98.1%, a difference of 0.030%).
| Demographics | Rating | Rank | 4th Grade |
| Native Hawaiians | 99.9 /100 | #44 | Exceptional 98.1% |
| Czechoslovakians | 99.9 /100 | #45 | Exceptional 98.1% |
| Ottawa | 99.9 /100 | #46 | Exceptional 98.1% |
| Arapaho | 99.9 /100 | #47 | Exceptional 98.1% |
| Estonians | 99.8 /100 | #48 | Exceptional 98.1% |
| Bulgarians | 99.8 /100 | #49 | Exceptional 98.1% |
| Immigrants | Scotland | 99.8 /100 | #50 | Exceptional 98.1% |
| Celtics | 99.8 /100 | #51 | Exceptional 98.1% |
| Australians | 99.8 /100 | #52 | Exceptional 98.1% |
| Slavs | 99.8 /100 | #53 | Exceptional 98.1% |
| Maltese | 99.8 /100 | #54 | Exceptional 98.1% |
| Whites/Caucasians | 99.8 /100 | #55 | Exceptional 98.1% |
| Greeks | 99.8 /100 | #56 | Exceptional 98.1% |
| Austrians | 99.8 /100 | #57 | Exceptional 98.1% |
| Creek | 99.8 /100 | #58 | Exceptional 98.1% |
| Americans | 99.8 /100 | #59 | Exceptional 98.1% |
| Immigrants | Canada | 99.7 /100 | #60 | Exceptional 98.1% |
| Immigrants | North America | 99.7 /100 | #61 | Exceptional 98.1% |
| Serbians | 99.7 /100 | #62 | Exceptional 98.1% |
| Russians | 99.7 /100 | #63 | Exceptional 98.0% |
| Cajuns | 99.7 /100 | #64 | Exceptional 98.0% |