Cajun vs Immigrants from Brazil No Schooling Completed
COMPARE
Cajun
Immigrants from Brazil
No Schooling Completed
No Schooling Completed Comparison
Cajuns
Immigrants from Brazil
1.7%
NO SCHOOLING COMPLETED
99.5/ 100
METRIC RATING
72nd/ 347
METRIC RANK
2.1%
NO SCHOOLING COMPLETED
63.8/ 100
METRIC RATING
162nd/ 347
METRIC RANK
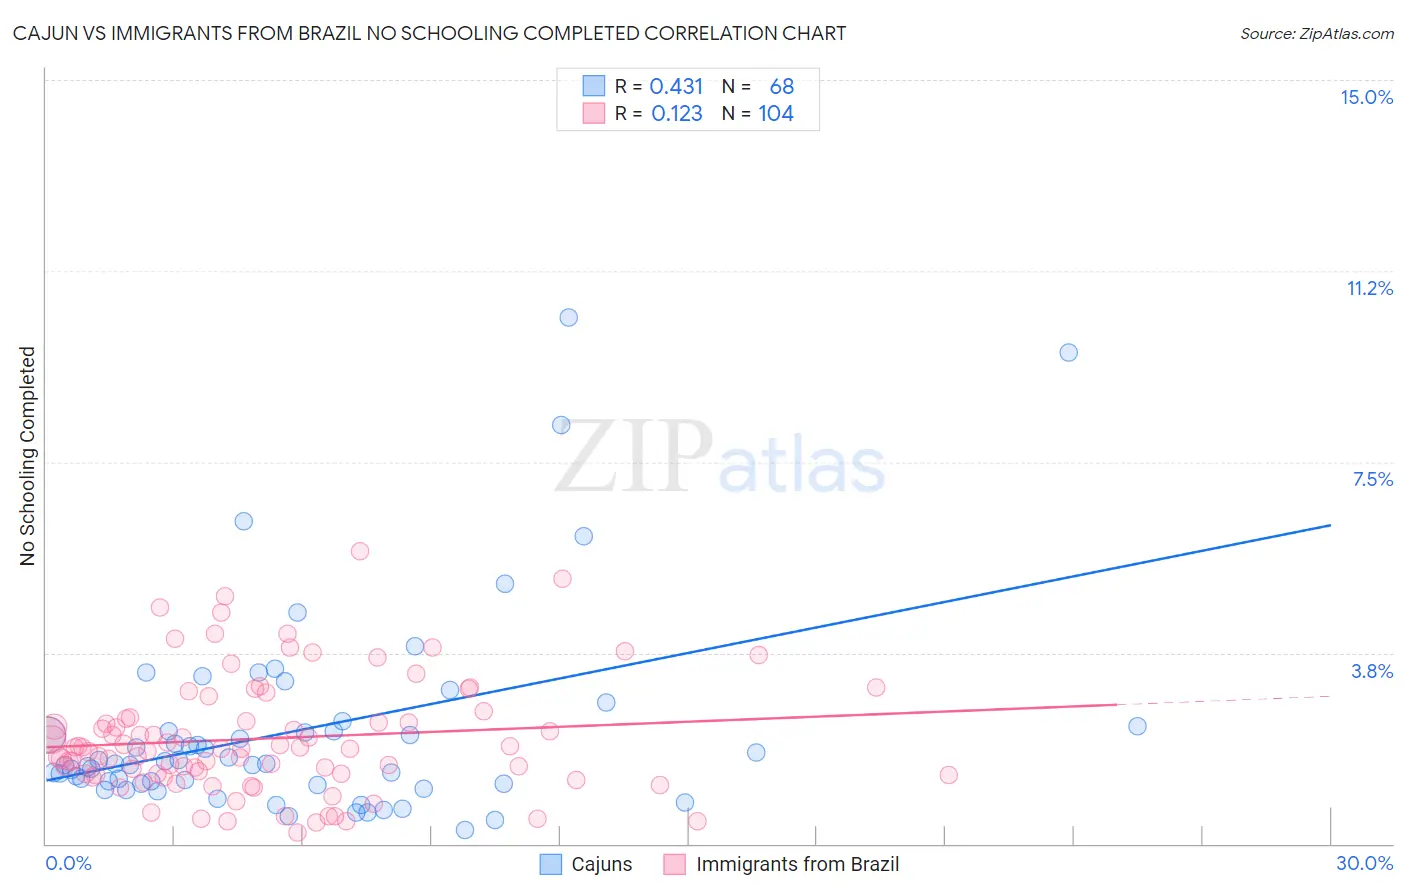
Cajun vs Immigrants from Brazil No Schooling Completed Correlation Chart
The statistical analysis conducted on geographies consisting of 148,907,341 people shows a moderate positive correlation between the proportion of Cajuns and percentage of population with no schooling in the United States with a correlation coefficient (R) of 0.431 and weighted average of 1.7%. Similarly, the statistical analysis conducted on geographies consisting of 340,005,374 people shows a poor positive correlation between the proportion of Immigrants from Brazil and percentage of population with no schooling in the United States with a correlation coefficient (R) of 0.123 and weighted average of 2.1%, a difference of 19.3%.
No Schooling Completed Correlation Summary
| Measurement | Cajun | Immigrants from Brazil |
| Minimum | 0.26% | 0.21% |
| Maximum | 10.3% | 5.7% |
| Range | 10.1% | 5.5% |
| Mean | 2.2% | 2.1% |
| Median | 1.6% | 1.9% |
| Interquartile 25% (IQ1) | 1.2% | 1.4% |
| Interquartile 75% (IQ3) | 2.3% | 2.5% |
| Interquartile Range (IQR) | 1.1% | 1.1% |
| Standard Deviation (Sample) | 2.0% | 1.1% |
| Standard Deviation (Population) | 2.0% | 1.1% |
Similar Demographics by No Schooling Completed
Demographics Similar to Cajuns by No Schooling Completed
In terms of no schooling completed, the demographic groups most similar to Cajuns are Immigrants from England (1.7%, a difference of 0.17%), Immigrants from India (1.7%, a difference of 0.48%), Zimbabwean (1.7%, a difference of 0.50%), Immigrants from Netherlands (1.7%, a difference of 0.51%), and Immigrants from Belgium (1.7%, a difference of 1.1%).
| Demographics | Rating | Rank | No Schooling Completed |
| Serbians | 99.7 /100 | #65 | Exceptional 1.7% |
| Canadians | 99.7 /100 | #66 | Exceptional 1.7% |
| Immigrants | Austria | 99.7 /100 | #67 | Exceptional 1.7% |
| Immigrants | Lithuania | 99.7 /100 | #68 | Exceptional 1.7% |
| Chickasaw | 99.6 /100 | #69 | Exceptional 1.7% |
| Immigrants | Netherlands | 99.6 /100 | #70 | Exceptional 1.7% |
| Immigrants | England | 99.5 /100 | #71 | Exceptional 1.7% |
| Cajuns | 99.5 /100 | #72 | Exceptional 1.7% |
| Immigrants | India | 99.4 /100 | #73 | Exceptional 1.7% |
| Zimbabweans | 99.4 /100 | #74 | Exceptional 1.7% |
| Immigrants | Belgium | 99.3 /100 | #75 | Exceptional 1.7% |
| Cherokee | 99.3 /100 | #76 | Exceptional 1.7% |
| Immigrants | Sweden | 99.3 /100 | #77 | Exceptional 1.7% |
| Delaware | 99.3 /100 | #78 | Exceptional 1.7% |
| Macedonians | 99.3 /100 | #79 | Exceptional 1.7% |
Demographics Similar to Immigrants from Brazil by No Schooling Completed
In terms of no schooling completed, the demographic groups most similar to Immigrants from Brazil are Ugandan (2.0%, a difference of 0.11%), Albanian (2.1%, a difference of 0.24%), Kenyan (2.0%, a difference of 0.28%), Immigrants from Spain (2.0%, a difference of 0.39%), and Immigrants from Korea (2.0%, a difference of 0.44%).
| Demographics | Rating | Rank | No Schooling Completed |
| Immigrants | Russia | 67.6 /100 | #155 | Good 2.0% |
| Chileans | 67.2 /100 | #156 | Good 2.0% |
| Immigrants | Sri Lanka | 67.0 /100 | #157 | Good 2.0% |
| Immigrants | Korea | 66.7 /100 | #158 | Good 2.0% |
| Immigrants | Spain | 66.4 /100 | #159 | Good 2.0% |
| Kenyans | 65.7 /100 | #160 | Good 2.0% |
| Ugandans | 64.6 /100 | #161 | Good 2.0% |
| Immigrants | Brazil | 63.8 /100 | #162 | Good 2.1% |
| Albanians | 62.2 /100 | #163 | Good 2.1% |
| Comanche | 60.7 /100 | #164 | Good 2.1% |
| Brazilians | 60.2 /100 | #165 | Good 2.1% |
| Dutch West Indians | 59.9 /100 | #166 | Average 2.1% |
| Egyptians | 59.2 /100 | #167 | Average 2.1% |
| Cheyenne | 58.6 /100 | #168 | Average 2.1% |
| Apache | 56.7 /100 | #169 | Average 2.1% |