Immigrants from Uzbekistan vs Immigrants from Brazil No Schooling Completed
COMPARE
Immigrants from Uzbekistan
Immigrants from Brazil
No Schooling Completed
No Schooling Completed Comparison
Immigrants from Uzbekistan
Immigrants from Brazil
2.6%
NO SCHOOLING COMPLETED
0.1/ 100
METRIC RATING
278th/ 347
METRIC RANK
2.1%
NO SCHOOLING COMPLETED
63.8/ 100
METRIC RATING
162nd/ 347
METRIC RANK
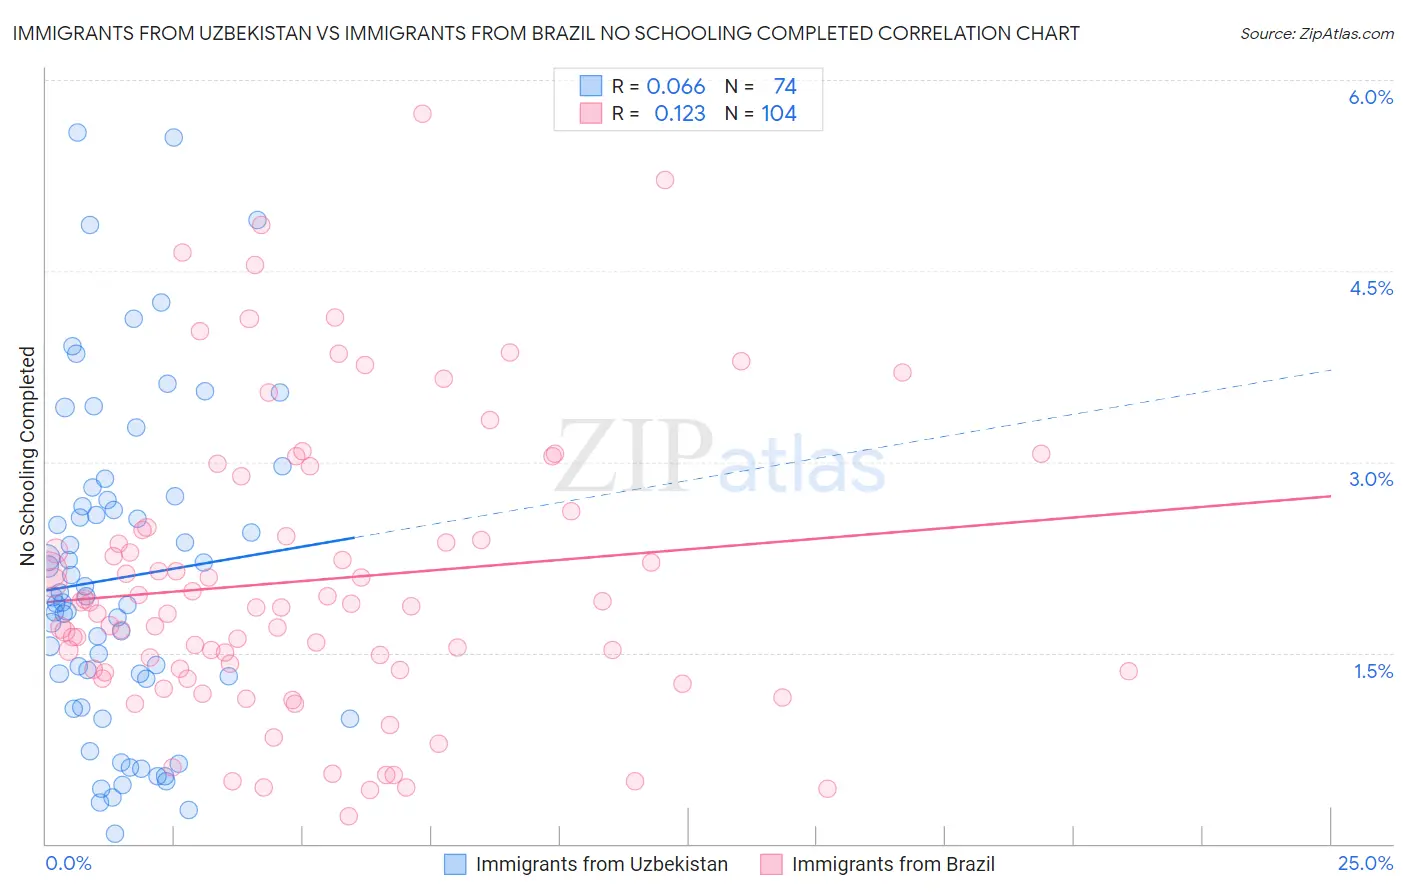
Immigrants from Uzbekistan vs Immigrants from Brazil No Schooling Completed Correlation Chart
The statistical analysis conducted on geographies consisting of 118,288,407 people shows a slight positive correlation between the proportion of Immigrants from Uzbekistan and percentage of population with no schooling in the United States with a correlation coefficient (R) of 0.066 and weighted average of 2.6%. Similarly, the statistical analysis conducted on geographies consisting of 340,005,374 people shows a poor positive correlation between the proportion of Immigrants from Brazil and percentage of population with no schooling in the United States with a correlation coefficient (R) of 0.123 and weighted average of 2.1%, a difference of 26.0%.
No Schooling Completed Correlation Summary
| Measurement | Immigrants from Uzbekistan | Immigrants from Brazil |
| Minimum | 0.076% | 0.21% |
| Maximum | 5.6% | 5.7% |
| Range | 5.5% | 5.5% |
| Mean | 2.1% | 2.1% |
| Median | 1.9% | 1.9% |
| Interquartile 25% (IQ1) | 1.3% | 1.4% |
| Interquartile 75% (IQ3) | 2.7% | 2.5% |
| Interquartile Range (IQR) | 1.4% | 1.1% |
| Standard Deviation (Sample) | 1.3% | 1.1% |
| Standard Deviation (Population) | 1.3% | 1.1% |
Similar Demographics by No Schooling Completed
Demographics Similar to Immigrants from Uzbekistan by No Schooling Completed
In terms of no schooling completed, the demographic groups most similar to Immigrants from Uzbekistan are Immigrants from Philippines (2.6%, a difference of 0.20%), Immigrants from Western Africa (2.6%, a difference of 0.25%), Barbadian (2.6%, a difference of 0.55%), Trinidadian and Tobagonian (2.6%, a difference of 0.56%), and Afghan (2.6%, a difference of 0.64%).
| Demographics | Rating | Rank | No Schooling Completed |
| Cubans | 0.2 /100 | #271 | Tragic 2.5% |
| Immigrants | Bolivia | 0.2 /100 | #272 | Tragic 2.5% |
| Immigrants | Cameroon | 0.1 /100 | #273 | Tragic 2.5% |
| Ghanaians | 0.1 /100 | #274 | Tragic 2.6% |
| Immigrants | China | 0.1 /100 | #275 | Tragic 2.6% |
| Immigrants | Western Africa | 0.1 /100 | #276 | Tragic 2.6% |
| Immigrants | Philippines | 0.1 /100 | #277 | Tragic 2.6% |
| Immigrants | Uzbekistan | 0.1 /100 | #278 | Tragic 2.6% |
| Barbadians | 0.1 /100 | #279 | Tragic 2.6% |
| Trinidadians and Tobagonians | 0.1 /100 | #280 | Tragic 2.6% |
| Afghans | 0.1 /100 | #281 | Tragic 2.6% |
| Immigrants | Ghana | 0.1 /100 | #282 | Tragic 2.6% |
| Immigrants | Trinidad and Tobago | 0.0 /100 | #283 | Tragic 2.6% |
| Immigrants | West Indies | 0.0 /100 | #284 | Tragic 2.7% |
| Immigrants | Barbados | 0.0 /100 | #285 | Tragic 2.7% |
Demographics Similar to Immigrants from Brazil by No Schooling Completed
In terms of no schooling completed, the demographic groups most similar to Immigrants from Brazil are Ugandan (2.0%, a difference of 0.11%), Albanian (2.1%, a difference of 0.24%), Kenyan (2.0%, a difference of 0.28%), Immigrants from Spain (2.0%, a difference of 0.39%), and Immigrants from Korea (2.0%, a difference of 0.44%).
| Demographics | Rating | Rank | No Schooling Completed |
| Immigrants | Russia | 67.6 /100 | #155 | Good 2.0% |
| Chileans | 67.2 /100 | #156 | Good 2.0% |
| Immigrants | Sri Lanka | 67.0 /100 | #157 | Good 2.0% |
| Immigrants | Korea | 66.7 /100 | #158 | Good 2.0% |
| Immigrants | Spain | 66.4 /100 | #159 | Good 2.0% |
| Kenyans | 65.7 /100 | #160 | Good 2.0% |
| Ugandans | 64.6 /100 | #161 | Good 2.0% |
| Immigrants | Brazil | 63.8 /100 | #162 | Good 2.1% |
| Albanians | 62.2 /100 | #163 | Good 2.1% |
| Comanche | 60.7 /100 | #164 | Good 2.1% |
| Brazilians | 60.2 /100 | #165 | Good 2.1% |
| Dutch West Indians | 59.9 /100 | #166 | Average 2.1% |
| Egyptians | 59.2 /100 | #167 | Average 2.1% |
| Cheyenne | 58.6 /100 | #168 | Average 2.1% |
| Apache | 56.7 /100 | #169 | Average 2.1% |