Burmese vs Immigrants from Zaire 9th Grade
COMPARE
Burmese
Immigrants from Zaire
9th Grade
9th Grade Comparison
Burmese
Immigrants from Zaire
95.4%
9TH GRADE
96.0/ 100
METRIC RATING
115th/ 347
METRIC RANK
94.6%
9TH GRADE
20.6/ 100
METRIC RATING
200th/ 347
METRIC RANK
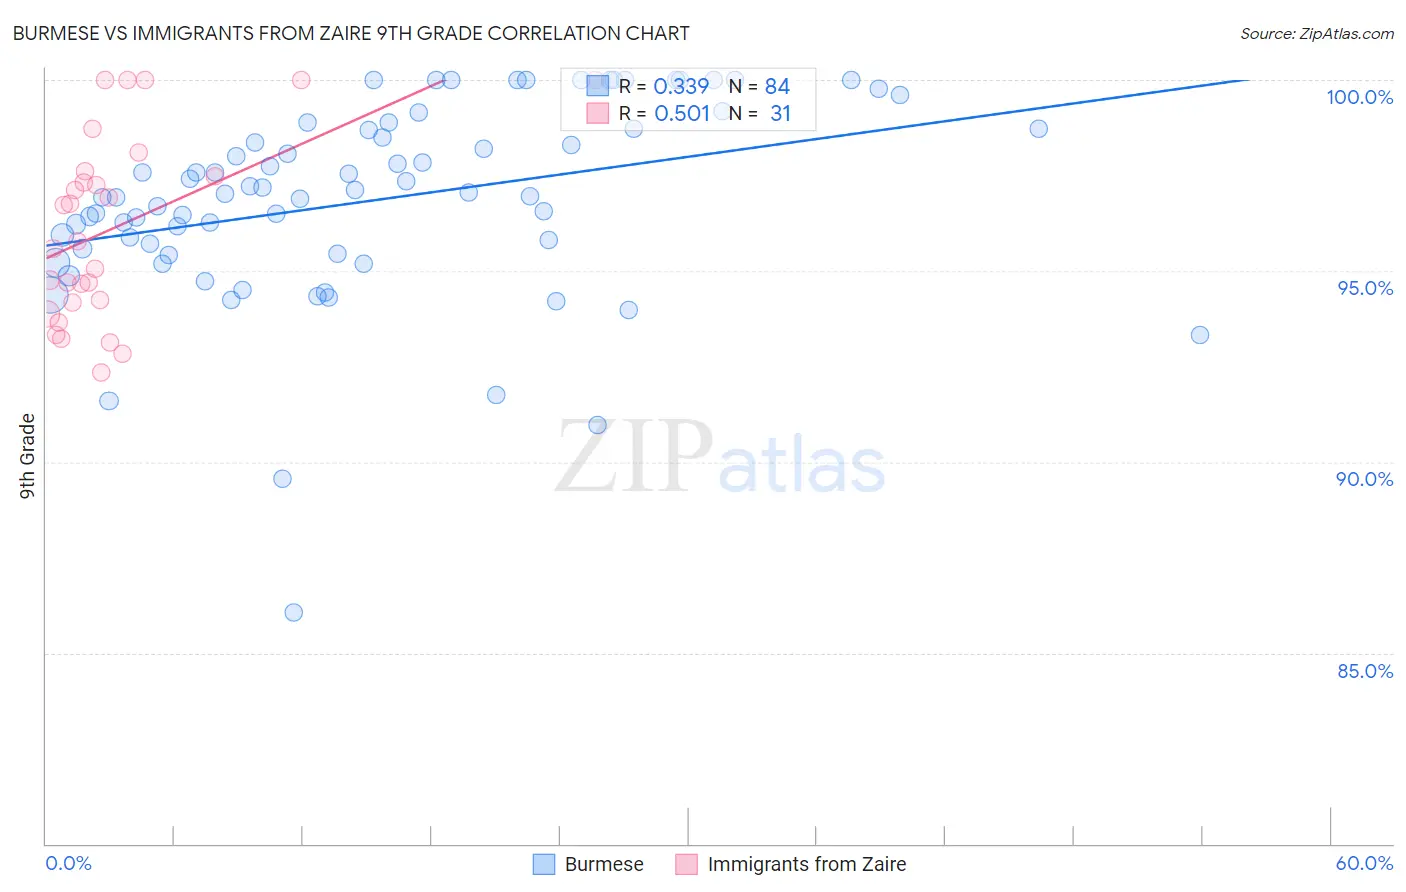
Burmese vs Immigrants from Zaire 9th Grade Correlation Chart
The statistical analysis conducted on geographies consisting of 465,275,888 people shows a mild positive correlation between the proportion of Burmese and percentage of population with at least 9th grade education in the United States with a correlation coefficient (R) of 0.339 and weighted average of 95.4%. Similarly, the statistical analysis conducted on geographies consisting of 107,212,695 people shows a substantial positive correlation between the proportion of Immigrants from Zaire and percentage of population with at least 9th grade education in the United States with a correlation coefficient (R) of 0.501 and weighted average of 94.6%, a difference of 0.83%.
9th Grade Correlation Summary
| Measurement | Burmese | Immigrants from Zaire |
| Minimum | 86.1% | 92.3% |
| Maximum | 100.0% | 100.0% |
| Range | 13.9% | 7.7% |
| Mean | 96.9% | 96.1% |
| Median | 97.0% | 95.8% |
| Interquartile 25% (IQ1) | 95.5% | 94.2% |
| Interquartile 75% (IQ3) | 98.7% | 97.6% |
| Interquartile Range (IQR) | 3.2% | 3.4% |
| Standard Deviation (Sample) | 2.6% | 2.4% |
| Standard Deviation (Population) | 2.6% | 2.4% |
Similar Demographics by 9th Grade
Demographics Similar to Burmese by 9th Grade
In terms of 9th grade, the demographic groups most similar to Burmese are German Russian (95.4%, a difference of 0.0%), Cherokee (95.4%, a difference of 0.010%), Immigrants from Croatia (95.4%, a difference of 0.010%), Iroquois (95.4%, a difference of 0.010%), and Immigrants from Europe (95.4%, a difference of 0.010%).
| Demographics | Rating | Rank | 9th Grade |
| Chickasaw | 96.8 /100 | #108 | Exceptional 95.5% |
| Osage | 96.8 /100 | #109 | Exceptional 95.5% |
| Immigrants | Bulgaria | 96.7 /100 | #110 | Exceptional 95.5% |
| Cherokee | 96.3 /100 | #111 | Exceptional 95.4% |
| Immigrants | Croatia | 96.2 /100 | #112 | Exceptional 95.4% |
| Iroquois | 96.2 /100 | #113 | Exceptional 95.4% |
| German Russians | 96.1 /100 | #114 | Exceptional 95.4% |
| Burmese | 96.0 /100 | #115 | Exceptional 95.4% |
| Immigrants | Europe | 95.7 /100 | #116 | Exceptional 95.4% |
| Immigrants | Romania | 95.6 /100 | #117 | Exceptional 95.4% |
| Immigrants | Turkey | 95.6 /100 | #118 | Exceptional 95.4% |
| Soviet Union | 95.6 /100 | #119 | Exceptional 95.4% |
| Cambodians | 95.6 /100 | #120 | Exceptional 95.4% |
| Cree | 95.5 /100 | #121 | Exceptional 95.4% |
| Immigrants | Kuwait | 95.5 /100 | #122 | Exceptional 95.4% |
Demographics Similar to Immigrants from Zaire by 9th Grade
In terms of 9th grade, the demographic groups most similar to Immigrants from Zaire are Laotian (94.6%, a difference of 0.0%), Black/African American (94.6%, a difference of 0.0%), Immigrants from Eastern Asia (94.6%, a difference of 0.010%), Immigrants from Bahamas (94.6%, a difference of 0.010%), and Moroccan (94.6%, a difference of 0.010%).
| Demographics | Rating | Rank | 9th Grade |
| Paraguayans | 30.1 /100 | #193 | Fair 94.7% |
| Panamanians | 29.0 /100 | #194 | Fair 94.7% |
| Marshallese | 27.9 /100 | #195 | Fair 94.7% |
| Immigrants | Lebanon | 27.2 /100 | #196 | Fair 94.7% |
| Immigrants | Micronesia | 24.7 /100 | #197 | Fair 94.7% |
| Hawaiians | 22.7 /100 | #198 | Fair 94.7% |
| Laotians | 21.0 /100 | #199 | Fair 94.6% |
| Immigrants | Zaire | 20.6 /100 | #200 | Fair 94.6% |
| Blacks/African Americans | 20.5 /100 | #201 | Fair 94.6% |
| Immigrants | Eastern Asia | 19.8 /100 | #202 | Poor 94.6% |
| Immigrants | Bahamas | 19.8 /100 | #203 | Poor 94.6% |
| Moroccans | 19.6 /100 | #204 | Poor 94.6% |
| Immigrants | Sudan | 17.6 /100 | #205 | Poor 94.6% |
| Samoans | 17.3 /100 | #206 | Poor 94.6% |
| Immigrants | Morocco | 16.3 /100 | #207 | Poor 94.6% |