British West Indian vs Immigrants from Brazil 1st Grade
COMPARE
British West Indian
Immigrants from Brazil
1st Grade
1st Grade Comparison
British West Indians
Immigrants from Brazil
97.2%
1ST GRADE
0.0/ 100
METRIC RATING
292nd/ 347
METRIC RANK
97.9%
1ST GRADE
49.1/ 100
METRIC RATING
177th/ 347
METRIC RANK
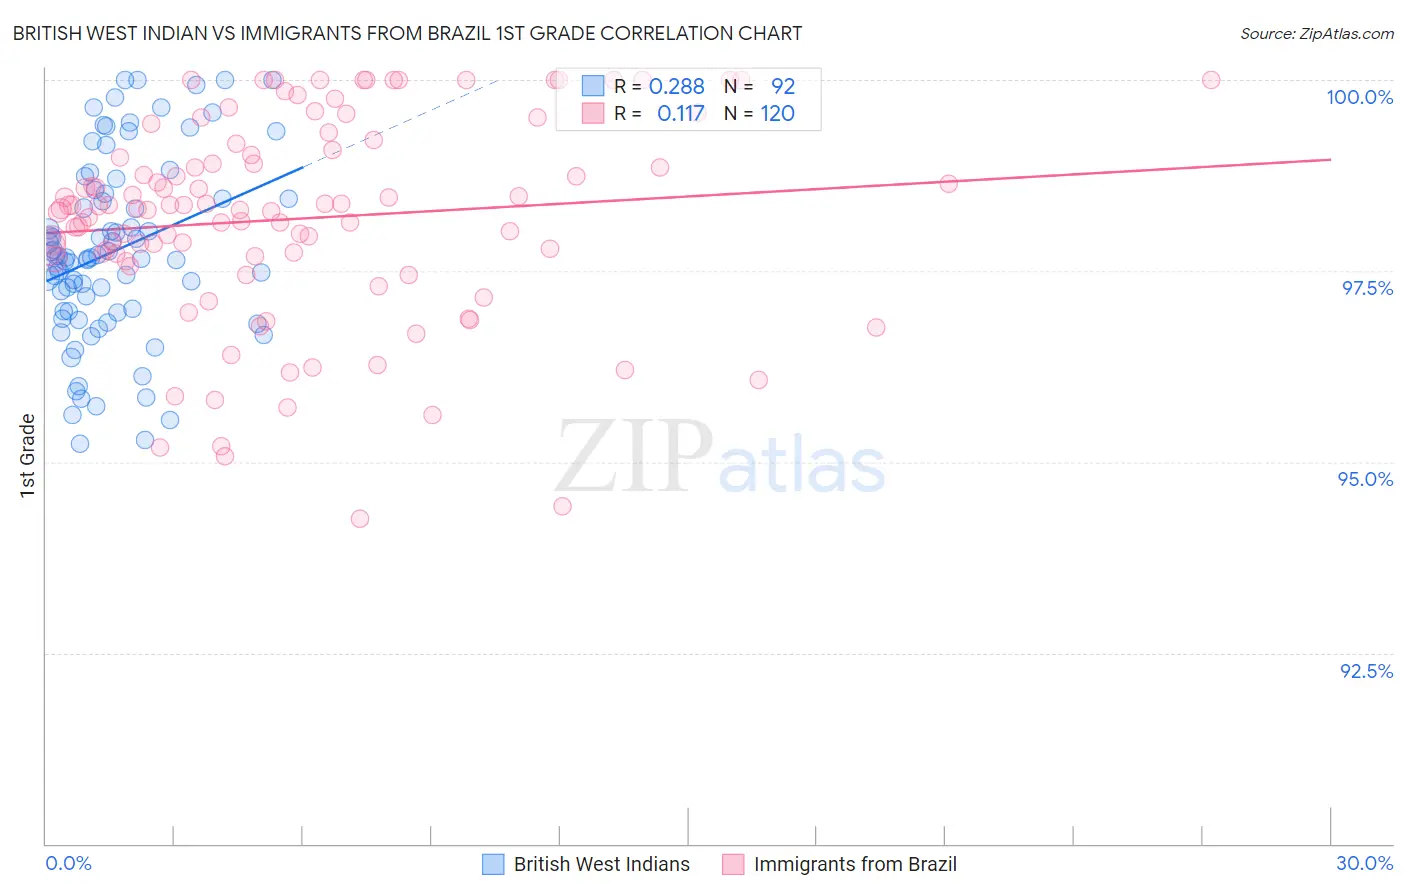
British West Indian vs Immigrants from Brazil 1st Grade Correlation Chart
The statistical analysis conducted on geographies consisting of 152,691,173 people shows a weak positive correlation between the proportion of British West Indians and percentage of population with at least 1st grade education in the United States with a correlation coefficient (R) of 0.288 and weighted average of 97.2%. Similarly, the statistical analysis conducted on geographies consisting of 343,021,580 people shows a poor positive correlation between the proportion of Immigrants from Brazil and percentage of population with at least 1st grade education in the United States with a correlation coefficient (R) of 0.117 and weighted average of 97.9%, a difference of 0.72%.
1st Grade Correlation Summary
| Measurement | British West Indian | Immigrants from Brazil |
| Minimum | 95.2% | 94.3% |
| Maximum | 100.0% | 100.0% |
| Range | 4.8% | 5.7% |
| Mean | 97.8% | 98.2% |
| Median | 97.7% | 98.3% |
| Interquartile 25% (IQ1) | 97.0% | 97.7% |
| Interquartile 75% (IQ3) | 98.5% | 99.1% |
| Interquartile Range (IQR) | 1.5% | 1.4% |
| Standard Deviation (Sample) | 1.2% | 1.3% |
| Standard Deviation (Population) | 1.2% | 1.3% |
Similar Demographics by 1st Grade
Demographics Similar to British West Indians by 1st Grade
In terms of 1st grade, the demographic groups most similar to British West Indians are Houma (97.2%, a difference of 0.020%), Malaysian (97.2%, a difference of 0.020%), Immigrants from St. Vincent and the Grenadines (97.3%, a difference of 0.030%), Immigrants from Afghanistan (97.3%, a difference of 0.040%), and Immigrants from Grenada (97.2%, a difference of 0.040%).
| Demographics | Rating | Rank | 1st Grade |
| Immigrants | Portugal | 0.0 /100 | #285 | Tragic 97.3% |
| Immigrants | Barbados | 0.0 /100 | #286 | Tragic 97.3% |
| Immigrants | Hong Kong | 0.0 /100 | #287 | Tragic 97.3% |
| Immigrants | Thailand | 0.0 /100 | #288 | Tragic 97.3% |
| Immigrants | Afghanistan | 0.0 /100 | #289 | Tragic 97.3% |
| Immigrants | St. Vincent and the Grenadines | 0.0 /100 | #290 | Tragic 97.3% |
| Houma | 0.0 /100 | #291 | Tragic 97.2% |
| British West Indians | 0.0 /100 | #292 | Tragic 97.2% |
| Malaysians | 0.0 /100 | #293 | Tragic 97.2% |
| Immigrants | Grenada | 0.0 /100 | #294 | Tragic 97.2% |
| Immigrants | Immigrants | 0.0 /100 | #295 | Tragic 97.2% |
| Immigrants | Eritrea | 0.0 /100 | #296 | Tragic 97.2% |
| Central American Indians | 0.0 /100 | #297 | Tragic 97.1% |
| Immigrants | Dominica | 0.0 /100 | #298 | Tragic 97.1% |
| Immigrants | Cuba | 0.0 /100 | #299 | Tragic 97.1% |
Demographics Similar to Immigrants from Brazil by 1st Grade
In terms of 1st grade, the demographic groups most similar to Immigrants from Brazil are Native/Alaskan (97.9%, a difference of 0.0%), Immigrants from Sri Lanka (97.9%, a difference of 0.0%), Albanian (97.9%, a difference of 0.0%), Immigrants from Venezuela (97.9%, a difference of 0.0%), and Immigrants from Jordan (97.9%, a difference of 0.010%).
| Demographics | Rating | Rank | 1st Grade |
| Immigrants | Spain | 54.9 /100 | #170 | Average 97.9% |
| Immigrants | Jordan | 53.9 /100 | #171 | Average 97.9% |
| Immigrants | Korea | 53.0 /100 | #172 | Average 97.9% |
| Kenyans | 51.2 /100 | #173 | Average 97.9% |
| Natives/Alaskans | 50.0 /100 | #174 | Average 97.9% |
| Immigrants | Sri Lanka | 49.7 /100 | #175 | Average 97.9% |
| Albanians | 49.6 /100 | #176 | Average 97.9% |
| Immigrants | Brazil | 49.1 /100 | #177 | Average 97.9% |
| Immigrants | Venezuela | 47.8 /100 | #178 | Average 97.9% |
| Argentineans | 47.2 /100 | #179 | Average 97.9% |
| Immigrants | Bosnia and Herzegovina | 46.6 /100 | #180 | Average 97.9% |
| Portuguese | 44.2 /100 | #181 | Average 97.9% |
| Egyptians | 42.7 /100 | #182 | Average 97.9% |
| Immigrants | Argentina | 41.3 /100 | #183 | Average 97.9% |
| Immigrants | Poland | 40.1 /100 | #184 | Average 97.9% |