Bolivian vs Immigrants from West Indies 5th Grade
COMPARE
Bolivian
Immigrants from West Indies
5th Grade
5th Grade Comparison
Bolivians
Immigrants from West Indies
96.9%
5TH GRADE
0.9/ 100
METRIC RATING
251st/ 347
METRIC RANK
96.5%
5TH GRADE
0.0/ 100
METRIC RATING
289th/ 347
METRIC RANK
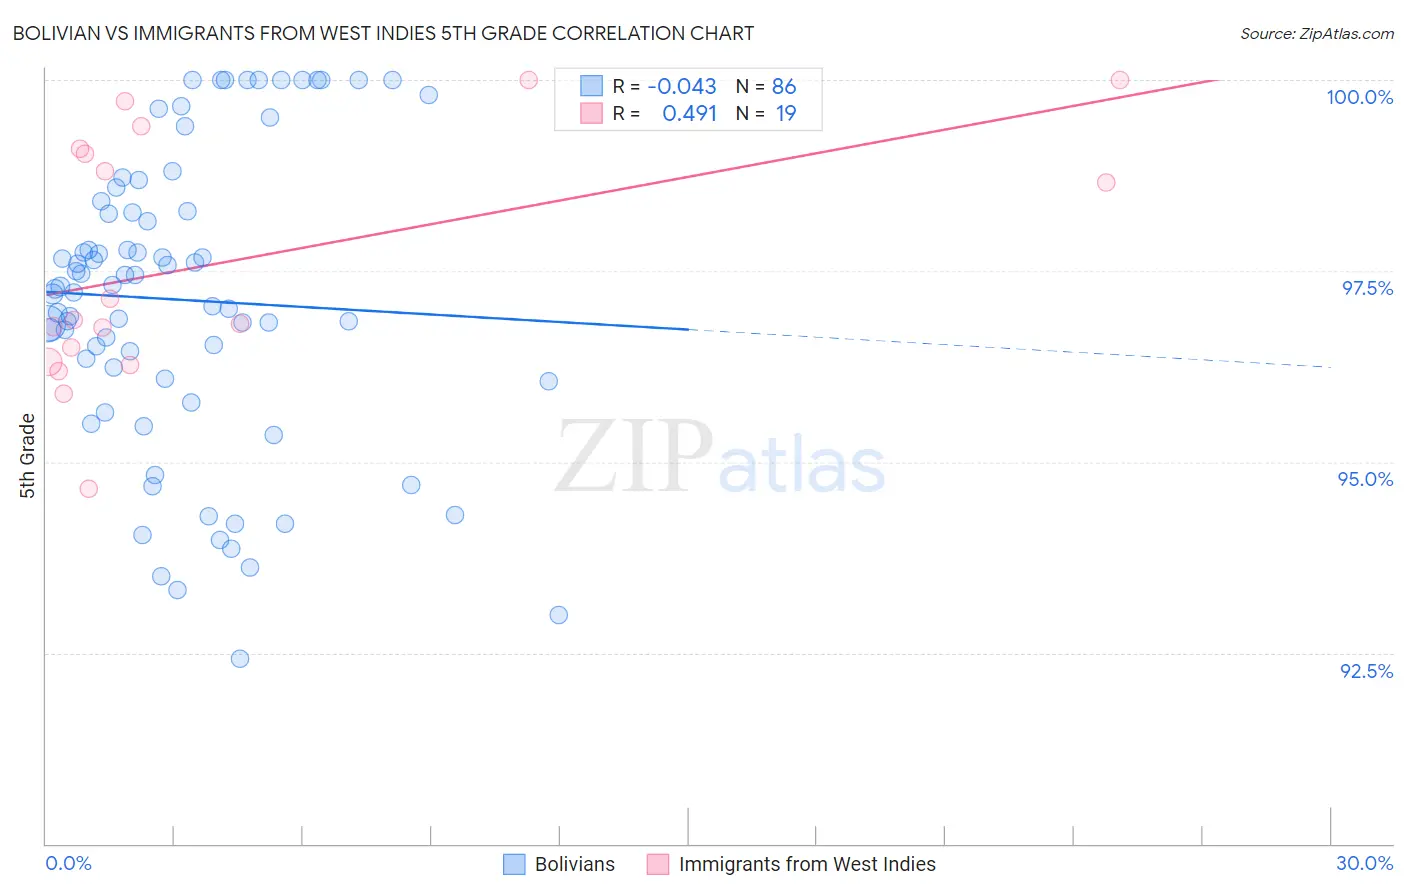
Bolivian vs Immigrants from West Indies 5th Grade Correlation Chart
The statistical analysis conducted on geographies consisting of 184,663,510 people shows no correlation between the proportion of Bolivians and percentage of population with at least 5th grade education in the United States with a correlation coefficient (R) of -0.043 and weighted average of 96.9%. Similarly, the statistical analysis conducted on geographies consisting of 72,457,514 people shows a moderate positive correlation between the proportion of Immigrants from West Indies and percentage of population with at least 5th grade education in the United States with a correlation coefficient (R) of 0.491 and weighted average of 96.5%, a difference of 0.38%.
5th Grade Correlation Summary
| Measurement | Bolivian | Immigrants from West Indies |
| Minimum | 92.4% | 94.6% |
| Maximum | 100.0% | 100.0% |
| Range | 7.6% | 5.4% |
| Mean | 97.1% | 97.6% |
| Median | 97.3% | 96.9% |
| Interquartile 25% (IQ1) | 96.1% | 96.3% |
| Interquartile 75% (IQ3) | 98.3% | 99.1% |
| Interquartile Range (IQR) | 2.2% | 2.8% |
| Standard Deviation (Sample) | 1.9% | 1.6% |
| Standard Deviation (Population) | 1.9% | 1.6% |
Similar Demographics by 5th Grade
Demographics Similar to Bolivians by 5th Grade
In terms of 5th grade, the demographic groups most similar to Bolivians are Immigrants from Uruguay (96.9%, a difference of 0.0%), Immigrants from Liberia (96.9%, a difference of 0.0%), Jamaican (96.9%, a difference of 0.0%), Immigrants from Africa (96.9%, a difference of 0.010%), and U.S. Virgin Islander (96.9%, a difference of 0.010%).
| Demographics | Rating | Rank | 5th Grade |
| Koreans | 1.6 /100 | #244 | Tragic 96.9% |
| Colombians | 1.3 /100 | #245 | Tragic 96.9% |
| Ethiopians | 1.2 /100 | #246 | Tragic 96.9% |
| Immigrants | Africa | 1.1 /100 | #247 | Tragic 96.9% |
| U.S. Virgin Islanders | 1.1 /100 | #248 | Tragic 96.9% |
| Immigrants | Uruguay | 1.0 /100 | #249 | Tragic 96.9% |
| Immigrants | Liberia | 1.0 /100 | #250 | Tragic 96.9% |
| Bolivians | 0.9 /100 | #251 | Tragic 96.9% |
| Jamaicans | 0.9 /100 | #252 | Tragic 96.9% |
| Immigrants | Middle Africa | 0.8 /100 | #253 | Tragic 96.8% |
| Immigrants | Senegal | 0.8 /100 | #254 | Tragic 96.8% |
| South Americans | 0.7 /100 | #255 | Tragic 96.8% |
| Immigrants | Congo | 0.7 /100 | #256 | Tragic 96.8% |
| Peruvians | 0.6 /100 | #257 | Tragic 96.8% |
| Immigrants | Ethiopia | 0.5 /100 | #258 | Tragic 96.8% |
Demographics Similar to Immigrants from West Indies by 5th Grade
In terms of 5th grade, the demographic groups most similar to Immigrants from West Indies are British West Indian (96.5%, a difference of 0.020%), Malaysian (96.5%, a difference of 0.020%), Somali (96.5%, a difference of 0.020%), Immigrants from Grenada (96.5%, a difference of 0.040%), and Immigrants from Afghanistan (96.6%, a difference of 0.070%).
| Demographics | Rating | Rank | 5th Grade |
| Barbadians | 0.1 /100 | #282 | Tragic 96.6% |
| Fijians | 0.1 /100 | #283 | Tragic 96.6% |
| Immigrants | Trinidad and Tobago | 0.1 /100 | #284 | Tragic 96.6% |
| Immigrants | St. Vincent and the Grenadines | 0.1 /100 | #285 | Tragic 96.6% |
| Immigrants | Thailand | 0.1 /100 | #286 | Tragic 96.6% |
| Immigrants | Afghanistan | 0.1 /100 | #287 | Tragic 96.6% |
| Immigrants | Barbados | 0.0 /100 | #288 | Tragic 96.6% |
| Immigrants | West Indies | 0.0 /100 | #289 | Tragic 96.5% |
| British West Indians | 0.0 /100 | #290 | Tragic 96.5% |
| Malaysians | 0.0 /100 | #291 | Tragic 96.5% |
| Somalis | 0.0 /100 | #292 | Tragic 96.5% |
| Immigrants | Grenada | 0.0 /100 | #293 | Tragic 96.5% |
| Immigrants | Eritrea | 0.0 /100 | #294 | Tragic 96.4% |
| Immigrants | Somalia | 0.0 /100 | #295 | Tragic 96.4% |
| Immigrants | South Eastern Asia | 0.0 /100 | #296 | Tragic 96.3% |