Blackfeet vs Immigrants from South Central Asia High School Diploma
COMPARE
Blackfeet
Immigrants from South Central Asia
High School Diploma
High School Diploma Comparison
Blackfeet
Immigrants from South Central Asia
88.1%
HIGH SCHOOL DIPLOMA
4.2/ 100
METRIC RATING
230th/ 347
METRIC RANK
90.9%
HIGH SCHOOL DIPLOMA
99.4/ 100
METRIC RATING
73rd/ 347
METRIC RANK
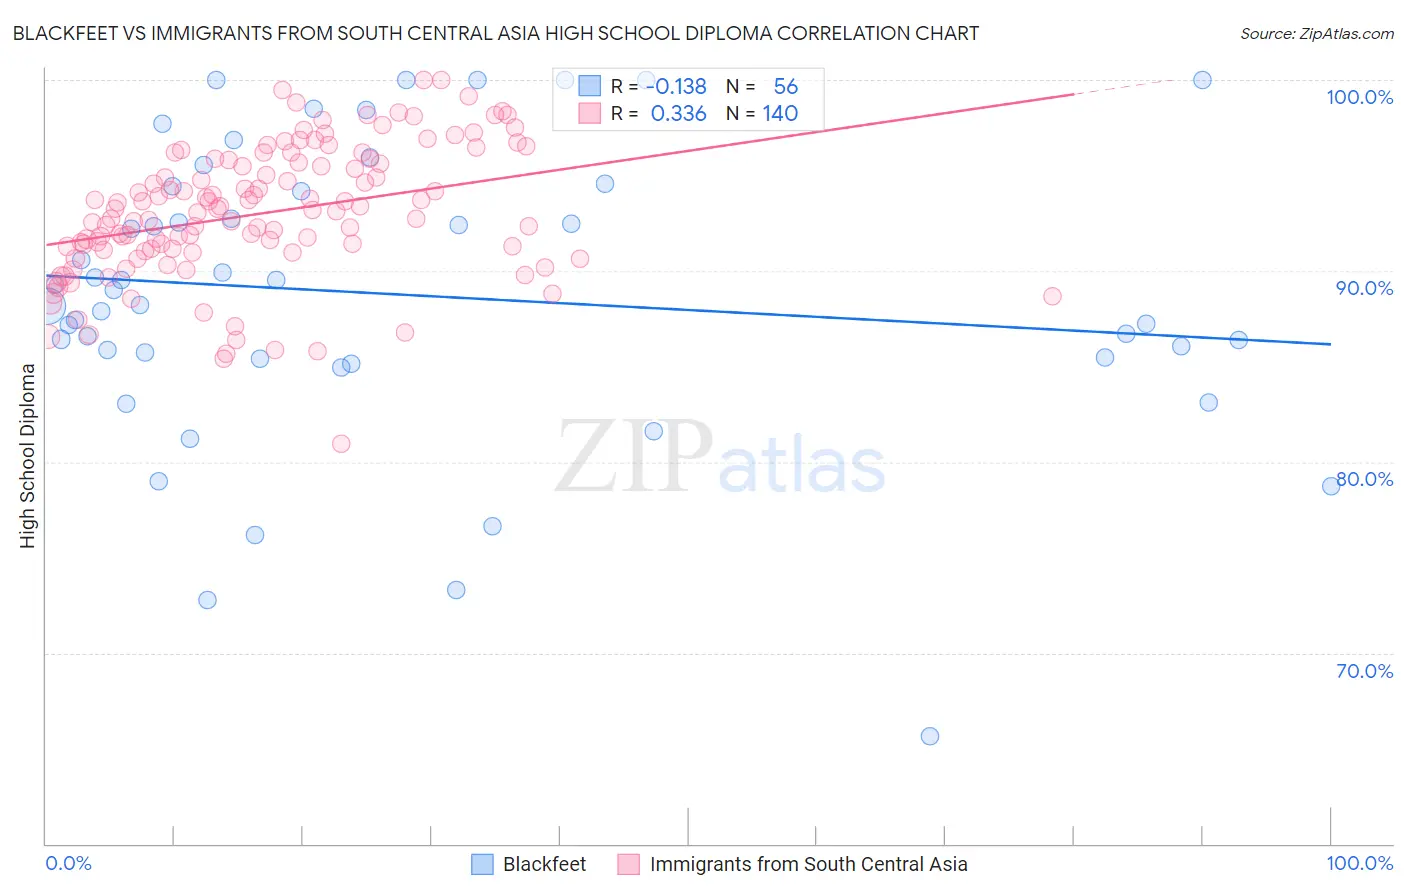
Blackfeet vs Immigrants from South Central Asia High School Diploma Correlation Chart
The statistical analysis conducted on geographies consisting of 309,582,193 people shows a poor negative correlation between the proportion of Blackfeet and percentage of population with at least high school diploma education in the United States with a correlation coefficient (R) of -0.138 and weighted average of 88.1%. Similarly, the statistical analysis conducted on geographies consisting of 473,113,181 people shows a mild positive correlation between the proportion of Immigrants from South Central Asia and percentage of population with at least high school diploma education in the United States with a correlation coefficient (R) of 0.336 and weighted average of 90.9%, a difference of 3.1%.
High School Diploma Correlation Summary
| Measurement | Blackfeet | Immigrants from South Central Asia |
| Minimum | 65.6% | 80.9% |
| Maximum | 100.0% | 100.0% |
| Range | 34.4% | 19.1% |
| Mean | 88.8% | 93.0% |
| Median | 88.6% | 93.2% |
| Interquartile 25% (IQ1) | 85.4% | 91.1% |
| Interquartile 75% (IQ3) | 94.3% | 95.8% |
| Interquartile Range (IQR) | 8.9% | 4.7% |
| Standard Deviation (Sample) | 7.6% | 3.5% |
| Standard Deviation (Population) | 7.5% | 3.5% |
Similar Demographics by High School Diploma
Demographics Similar to Blackfeet by High School Diploma
In terms of high school diploma, the demographic groups most similar to Blackfeet are Colombian (88.1%, a difference of 0.040%), Nigerian (88.2%, a difference of 0.080%), Kiowa (88.2%, a difference of 0.090%), Immigrants from Middle Africa (88.0%, a difference of 0.090%), and Immigrants from Liberia (88.2%, a difference of 0.10%).
| Demographics | Rating | Rank | High School Diploma |
| Immigrants | Zaire | 7.6 /100 | #223 | Tragic 88.3% |
| Shoshone | 7.0 /100 | #224 | Tragic 88.3% |
| Creek | 6.9 /100 | #225 | Tragic 88.3% |
| Uruguayans | 5.6 /100 | #226 | Tragic 88.2% |
| Immigrants | Liberia | 5.5 /100 | #227 | Tragic 88.2% |
| Kiowa | 5.3 /100 | #228 | Tragic 88.2% |
| Nigerians | 5.2 /100 | #229 | Tragic 88.2% |
| Blackfeet | 4.2 /100 | #230 | Tragic 88.1% |
| Colombians | 3.8 /100 | #231 | Tragic 88.1% |
| Immigrants | Middle Africa | 3.4 /100 | #232 | Tragic 88.0% |
| Immigrants | Panama | 3.1 /100 | #233 | Tragic 88.0% |
| Immigrants | Thailand | 3.1 /100 | #234 | Tragic 88.0% |
| Immigrants | Bahamas | 2.9 /100 | #235 | Tragic 88.0% |
| Sub-Saharan Africans | 2.8 /100 | #236 | Tragic 87.9% |
| Taiwanese | 2.8 /100 | #237 | Tragic 87.9% |
Demographics Similar to Immigrants from South Central Asia by High School Diploma
In terms of high school diploma, the demographic groups most similar to Immigrants from South Central Asia are Immigrants from Czechoslovakia (90.9%, a difference of 0.010%), Cambodian (90.8%, a difference of 0.020%), Immigrants from Latvia (90.9%, a difference of 0.030%), Alaskan Athabascan (90.9%, a difference of 0.030%), and Soviet Union (90.9%, a difference of 0.030%).
| Demographics | Rating | Rank | High School Diploma |
| French | 99.5 /100 | #66 | Exceptional 91.0% |
| Immigrants | Iran | 99.5 /100 | #67 | Exceptional 90.9% |
| Czechoslovakians | 99.5 /100 | #68 | Exceptional 90.9% |
| French Canadians | 99.5 /100 | #69 | Exceptional 90.9% |
| Immigrants | Latvia | 99.5 /100 | #70 | Exceptional 90.9% |
| Alaskan Athabascans | 99.4 /100 | #71 | Exceptional 90.9% |
| Soviet Union | 99.4 /100 | #72 | Exceptional 90.9% |
| Immigrants | South Central Asia | 99.4 /100 | #73 | Exceptional 90.9% |
| Immigrants | Czechoslovakia | 99.4 /100 | #74 | Exceptional 90.9% |
| Cambodians | 99.4 /100 | #75 | Exceptional 90.8% |
| Hungarians | 99.3 /100 | #76 | Exceptional 90.8% |
| Native Hawaiians | 99.3 /100 | #77 | Exceptional 90.8% |
| Burmese | 99.3 /100 | #78 | Exceptional 90.8% |
| Immigrants | Denmark | 99.3 /100 | #79 | Exceptional 90.8% |
| Immigrants | England | 99.3 /100 | #80 | Exceptional 90.8% |