Bhutanese vs Luxembourger 8th Grade
COMPARE
Bhutanese
Luxembourger
8th Grade
8th Grade Comparison
Bhutanese
Luxembourgers
96.4%
8TH GRADE
98.2/ 100
METRIC RATING
101st/ 347
METRIC RANK
97.0%
8TH GRADE
100.0/ 100
METRIC RATING
34th/ 347
METRIC RANK
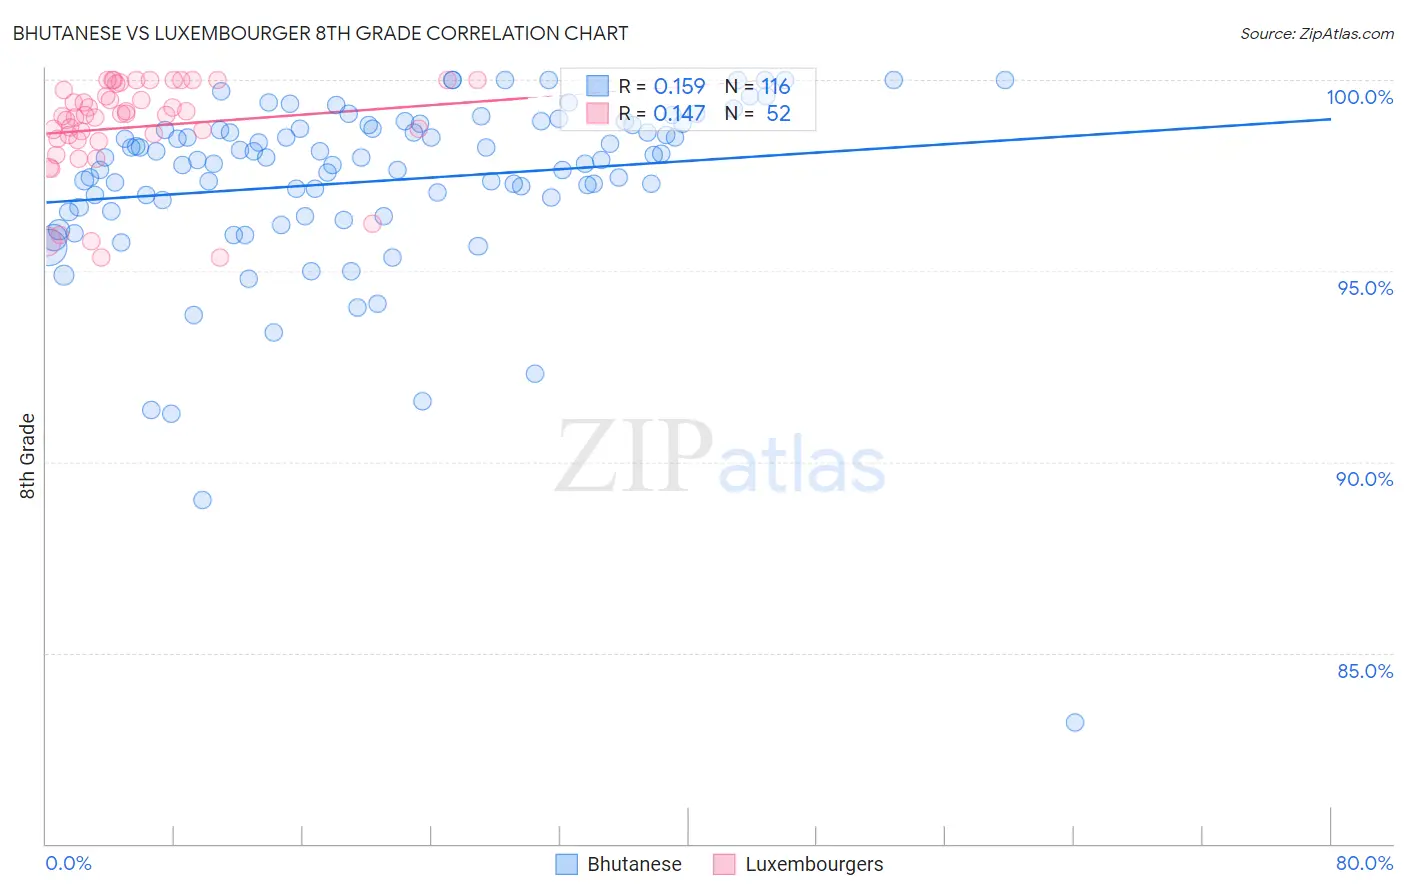
Bhutanese vs Luxembourger 8th Grade Correlation Chart
The statistical analysis conducted on geographies consisting of 455,591,134 people shows a poor positive correlation between the proportion of Bhutanese and percentage of population with at least 8th grade education in the United States with a correlation coefficient (R) of 0.159 and weighted average of 96.4%. Similarly, the statistical analysis conducted on geographies consisting of 144,675,512 people shows a poor positive correlation between the proportion of Luxembourgers and percentage of population with at least 8th grade education in the United States with a correlation coefficient (R) of 0.147 and weighted average of 97.0%, a difference of 0.68%.
8th Grade Correlation Summary
| Measurement | Bhutanese | Luxembourger |
| Minimum | 83.2% | 95.3% |
| Maximum | 100.0% | 100.0% |
| Range | 16.8% | 4.7% |
| Mean | 97.4% | 98.8% |
| Median | 97.9% | 99.1% |
| Interquartile 25% (IQ1) | 96.6% | 98.5% |
| Interquartile 75% (IQ3) | 98.8% | 99.8% |
| Interquartile Range (IQR) | 2.2% | 1.4% |
| Standard Deviation (Sample) | 2.4% | 1.3% |
| Standard Deviation (Population) | 2.4% | 1.3% |
Similar Demographics by 8th Grade
Demographics Similar to Bhutanese by 8th Grade
In terms of 8th grade, the demographic groups most similar to Bhutanese are South African (96.4%, a difference of 0.010%), Immigrants from Saudi Arabia (96.3%, a difference of 0.020%), Kiowa (96.3%, a difference of 0.020%), Immigrants from North Macedonia (96.3%, a difference of 0.020%), and Okinawan (96.3%, a difference of 0.020%).
| Demographics | Rating | Rank | 8th Grade |
| Immigrants | Singapore | 98.8 /100 | #94 | Exceptional 96.4% |
| German Russians | 98.8 /100 | #95 | Exceptional 96.4% |
| Potawatomi | 98.7 /100 | #96 | Exceptional 96.4% |
| Osage | 98.7 /100 | #97 | Exceptional 96.4% |
| Immigrants | Germany | 98.7 /100 | #98 | Exceptional 96.4% |
| Cree | 98.6 /100 | #99 | Exceptional 96.4% |
| Immigrants | Czechoslovakia | 98.6 /100 | #100 | Exceptional 96.4% |
| Bhutanese | 98.2 /100 | #101 | Exceptional 96.4% |
| South Africans | 98.2 /100 | #102 | Exceptional 96.4% |
| Immigrants | Saudi Arabia | 98.0 /100 | #103 | Exceptional 96.3% |
| Kiowa | 98.0 /100 | #104 | Exceptional 96.3% |
| Immigrants | North Macedonia | 98.0 /100 | #105 | Exceptional 96.3% |
| Okinawans | 98.0 /100 | #106 | Exceptional 96.3% |
| Immigrants | Latvia | 97.8 /100 | #107 | Exceptional 96.3% |
| Lebanese | 97.5 /100 | #108 | Exceptional 96.3% |
Demographics Similar to Luxembourgers by 8th Grade
In terms of 8th grade, the demographic groups most similar to Luxembourgers are Alaska Native (97.0%, a difference of 0.010%), Belgian (97.0%, a difference of 0.020%), Latvian (97.0%, a difference of 0.020%), Swiss (97.0%, a difference of 0.030%), and Yup'ik (97.0%, a difference of 0.040%).
| Demographics | Rating | Rank | 8th Grade |
| Scotch-Irish | 100.0 /100 | #27 | Exceptional 97.1% |
| Italians | 100.0 /100 | #28 | Exceptional 97.1% |
| Europeans | 100.0 /100 | #29 | Exceptional 97.1% |
| Sioux | 100.0 /100 | #30 | Exceptional 97.1% |
| Chippewa | 100.0 /100 | #31 | Exceptional 97.1% |
| Yup'ik | 100.0 /100 | #32 | Exceptional 97.0% |
| Swiss | 100.0 /100 | #33 | Exceptional 97.0% |
| Luxembourgers | 100.0 /100 | #34 | Exceptional 97.0% |
| Alaska Natives | 100.0 /100 | #35 | Exceptional 97.0% |
| Belgians | 100.0 /100 | #36 | Exceptional 97.0% |
| Latvians | 100.0 /100 | #37 | Exceptional 97.0% |
| British | 100.0 /100 | #38 | Exceptional 97.0% |
| Hungarians | 100.0 /100 | #39 | Exceptional 97.0% |
| Inupiat | 100.0 /100 | #40 | Exceptional 97.0% |
| Eastern Europeans | 100.0 /100 | #41 | Exceptional 97.0% |