Bhutanese vs Immigrants from Cameroon 8th Grade
COMPARE
Bhutanese
Immigrants from Cameroon
8th Grade
8th Grade Comparison
Bhutanese
Immigrants from Cameroon
96.4%
8TH GRADE
98.2/ 100
METRIC RATING
101st/ 347
METRIC RANK
95.0%
8TH GRADE
0.8/ 100
METRIC RATING
254th/ 347
METRIC RANK
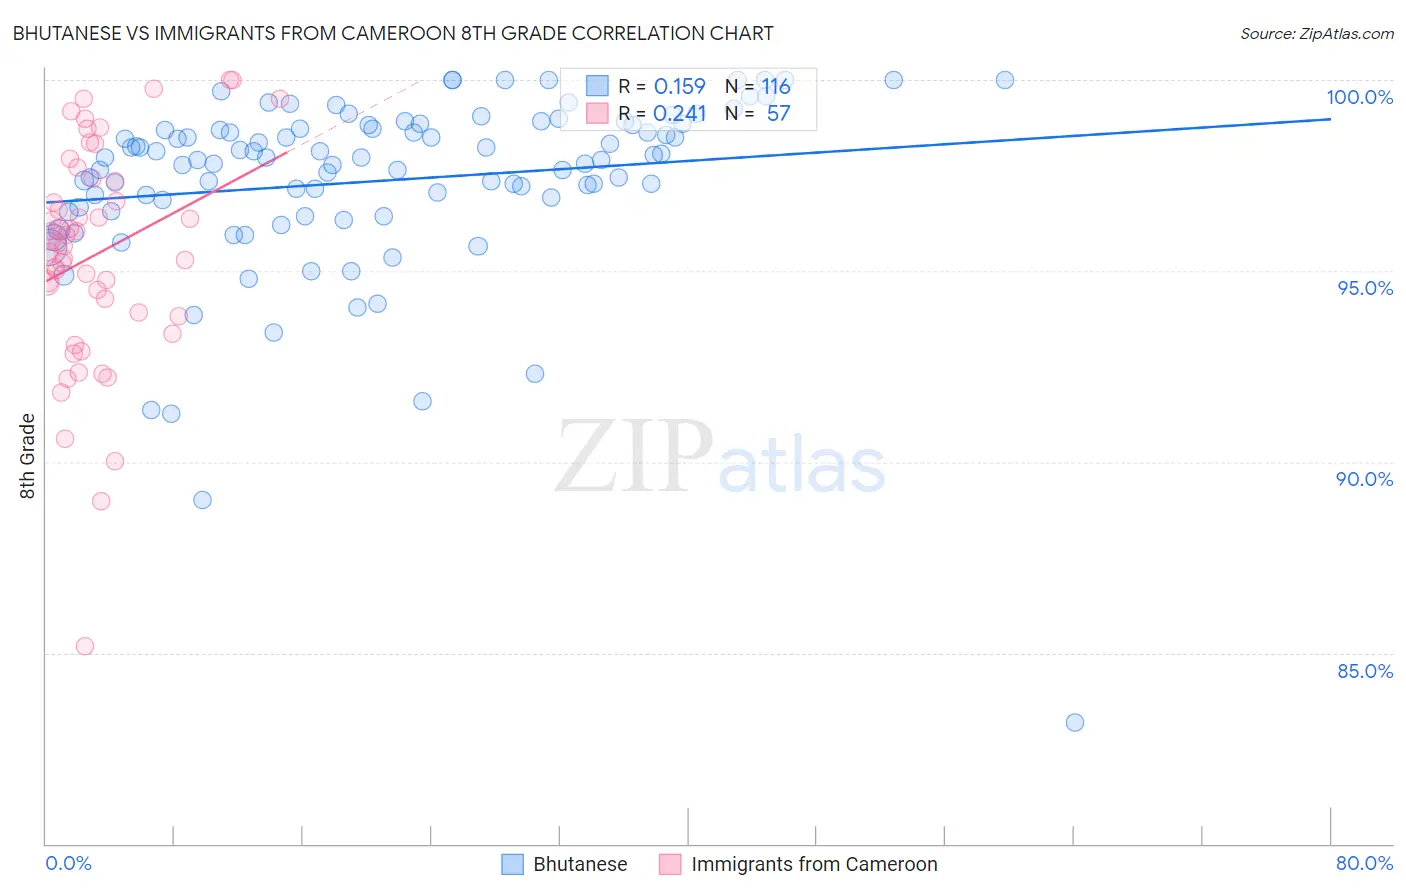
Bhutanese vs Immigrants from Cameroon 8th Grade Correlation Chart
The statistical analysis conducted on geographies consisting of 455,591,134 people shows a poor positive correlation between the proportion of Bhutanese and percentage of population with at least 8th grade education in the United States with a correlation coefficient (R) of 0.159 and weighted average of 96.4%. Similarly, the statistical analysis conducted on geographies consisting of 130,618,704 people shows a weak positive correlation between the proportion of Immigrants from Cameroon and percentage of population with at least 8th grade education in the United States with a correlation coefficient (R) of 0.241 and weighted average of 95.0%, a difference of 1.4%.
8th Grade Correlation Summary
| Measurement | Bhutanese | Immigrants from Cameroon |
| Minimum | 83.2% | 85.2% |
| Maximum | 100.0% | 100.0% |
| Range | 16.8% | 14.8% |
| Mean | 97.4% | 95.4% |
| Median | 97.9% | 95.7% |
| Interquartile 25% (IQ1) | 96.6% | 93.9% |
| Interquartile 75% (IQ3) | 98.8% | 97.4% |
| Interquartile Range (IQR) | 2.2% | 3.5% |
| Standard Deviation (Sample) | 2.4% | 2.9% |
| Standard Deviation (Population) | 2.4% | 2.9% |
Similar Demographics by 8th Grade
Demographics Similar to Bhutanese by 8th Grade
In terms of 8th grade, the demographic groups most similar to Bhutanese are South African (96.4%, a difference of 0.010%), Immigrants from Saudi Arabia (96.3%, a difference of 0.020%), Kiowa (96.3%, a difference of 0.020%), Immigrants from North Macedonia (96.3%, a difference of 0.020%), and Okinawan (96.3%, a difference of 0.020%).
| Demographics | Rating | Rank | 8th Grade |
| Immigrants | Singapore | 98.8 /100 | #94 | Exceptional 96.4% |
| German Russians | 98.8 /100 | #95 | Exceptional 96.4% |
| Potawatomi | 98.7 /100 | #96 | Exceptional 96.4% |
| Osage | 98.7 /100 | #97 | Exceptional 96.4% |
| Immigrants | Germany | 98.7 /100 | #98 | Exceptional 96.4% |
| Cree | 98.6 /100 | #99 | Exceptional 96.4% |
| Immigrants | Czechoslovakia | 98.6 /100 | #100 | Exceptional 96.4% |
| Bhutanese | 98.2 /100 | #101 | Exceptional 96.4% |
| South Africans | 98.2 /100 | #102 | Exceptional 96.4% |
| Immigrants | Saudi Arabia | 98.0 /100 | #103 | Exceptional 96.3% |
| Kiowa | 98.0 /100 | #104 | Exceptional 96.3% |
| Immigrants | North Macedonia | 98.0 /100 | #105 | Exceptional 96.3% |
| Okinawans | 98.0 /100 | #106 | Exceptional 96.3% |
| Immigrants | Latvia | 97.8 /100 | #107 | Exceptional 96.3% |
| Lebanese | 97.5 /100 | #108 | Exceptional 96.3% |
Demographics Similar to Immigrants from Cameroon by 8th Grade
In terms of 8th grade, the demographic groups most similar to Immigrants from Cameroon are U.S. Virgin Islander (95.0%, a difference of 0.020%), Immigrants from Somalia (95.0%, a difference of 0.020%), Bolivian (95.0%, a difference of 0.030%), Immigrants from Ethiopia (95.0%, a difference of 0.030%), and Colombian (95.0%, a difference of 0.030%).
| Demographics | Rating | Rank | 8th Grade |
| Immigrants | Senegal | 1.4 /100 | #247 | Tragic 95.1% |
| Uruguayans | 1.2 /100 | #248 | Tragic 95.1% |
| Immigrants | China | 1.1 /100 | #249 | Tragic 95.0% |
| Koreans | 1.1 /100 | #250 | Tragic 95.0% |
| Bolivians | 1.0 /100 | #251 | Tragic 95.0% |
| Immigrants | Ethiopia | 1.0 /100 | #252 | Tragic 95.0% |
| U.S. Virgin Islanders | 0.9 /100 | #253 | Tragic 95.0% |
| Immigrants | Cameroon | 0.8 /100 | #254 | Tragic 95.0% |
| Immigrants | Somalia | 0.7 /100 | #255 | Tragic 95.0% |
| Colombians | 0.7 /100 | #256 | Tragic 95.0% |
| Afghans | 0.6 /100 | #257 | Tragic 94.9% |
| Immigrants | Congo | 0.6 /100 | #258 | Tragic 94.9% |
| Ghanaians | 0.6 /100 | #259 | Tragic 94.9% |
| Immigrants | Jamaica | 0.6 /100 | #260 | Tragic 94.9% |
| Immigrants | Costa Rica | 0.5 /100 | #261 | Tragic 94.9% |