Pennsylvania German vs Nicaraguan High School Diploma
COMPARE
Pennsylvania German
Nicaraguan
High School Diploma
High School Diploma Comparison
Pennsylvania Germans
Nicaraguans
87.0%
HIGH SCHOOL DIPLOMA
0.2/ 100
METRIC RATING
268th/ 347
METRIC RANK
84.1%
HIGH SCHOOL DIPLOMA
0.0/ 100
METRIC RATING
320th/ 347
METRIC RANK
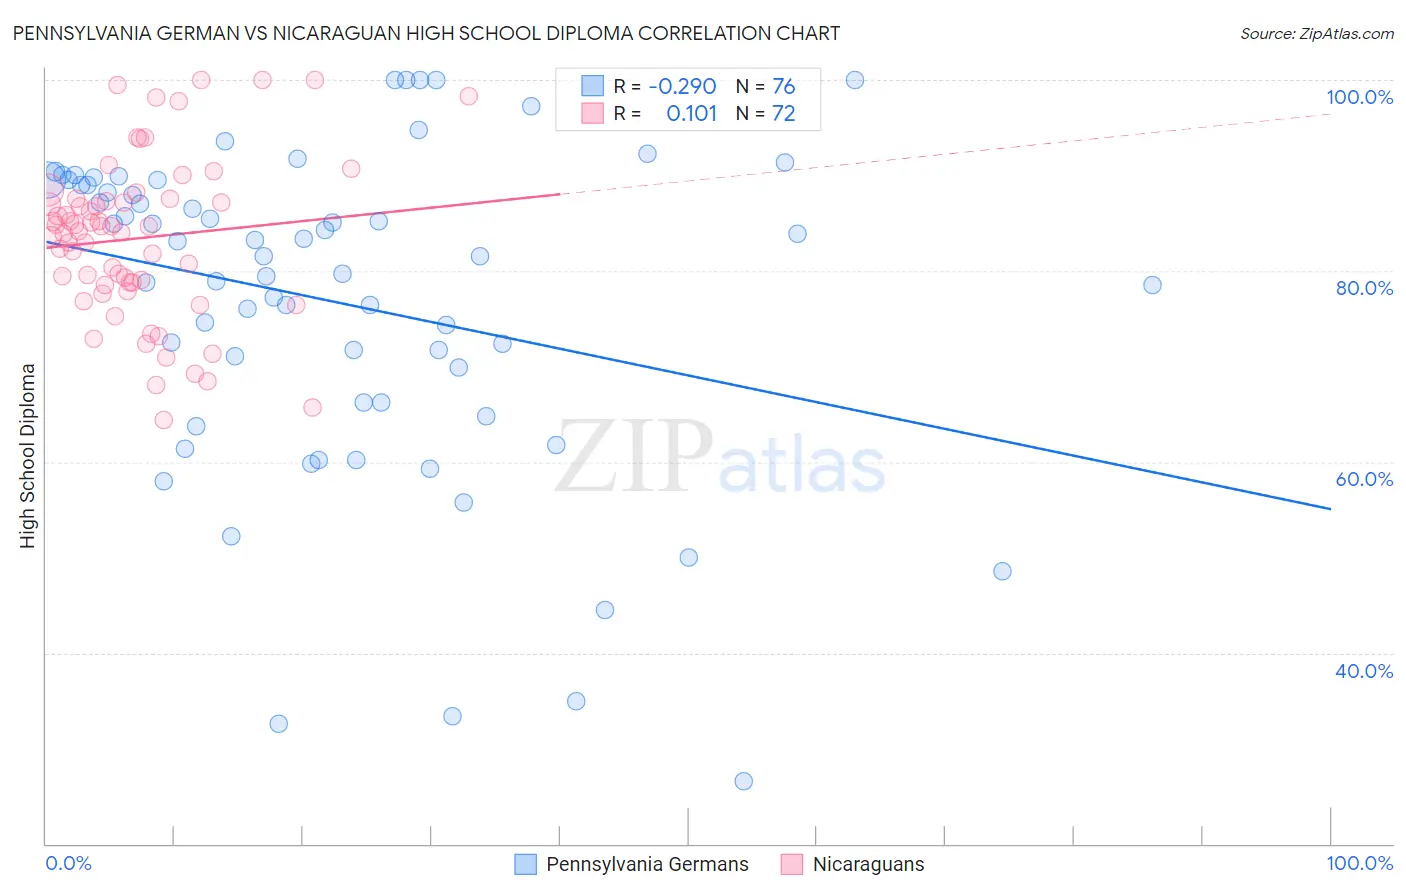
Pennsylvania German vs Nicaraguan High School Diploma Correlation Chart
The statistical analysis conducted on geographies consisting of 234,102,935 people shows a weak negative correlation between the proportion of Pennsylvania Germans and percentage of population with at least high school diploma education in the United States with a correlation coefficient (R) of -0.290 and weighted average of 87.0%. Similarly, the statistical analysis conducted on geographies consisting of 285,710,633 people shows a poor positive correlation between the proportion of Nicaraguans and percentage of population with at least high school diploma education in the United States with a correlation coefficient (R) of 0.101 and weighted average of 84.1%, a difference of 3.5%.
High School Diploma Correlation Summary
| Measurement | Pennsylvania German | Nicaraguan |
| Minimum | 26.6% | 64.4% |
| Maximum | 100.0% | 100.0% |
| Range | 73.4% | 35.6% |
| Mean | 76.7% | 83.4% |
| Median | 81.5% | 84.4% |
| Interquartile 25% (IQ1) | 66.2% | 78.7% |
| Interquartile 75% (IQ3) | 89.3% | 87.4% |
| Interquartile Range (IQR) | 23.1% | 8.8% |
| Standard Deviation (Sample) | 17.0% | 8.4% |
| Standard Deviation (Population) | 16.9% | 8.3% |
Similar Demographics by High School Diploma
Demographics Similar to Pennsylvania Germans by High School Diploma
In terms of high school diploma, the demographic groups most similar to Pennsylvania Germans are Sri Lankan (87.0%, a difference of 0.010%), Malaysian (87.0%, a difference of 0.020%), Black/African American (87.0%, a difference of 0.030%), Immigrants from Congo (87.0%, a difference of 0.050%), and West Indian (86.9%, a difference of 0.090%).
| Demographics | Rating | Rank | High School Diploma |
| Seminole | 0.4 /100 | #261 | Tragic 87.3% |
| Immigrants | Peru | 0.4 /100 | #262 | Tragic 87.3% |
| Immigrants | South Eastern Asia | 0.3 /100 | #263 | Tragic 87.2% |
| Jamaicans | 0.3 /100 | #264 | Tragic 87.2% |
| U.S. Virgin Islanders | 0.2 /100 | #265 | Tragic 87.1% |
| Immigrants | Congo | 0.2 /100 | #266 | Tragic 87.0% |
| Blacks/African Americans | 0.2 /100 | #267 | Tragic 87.0% |
| Pennsylvania Germans | 0.2 /100 | #268 | Tragic 87.0% |
| Sri Lankans | 0.2 /100 | #269 | Tragic 87.0% |
| Malaysians | 0.2 /100 | #270 | Tragic 87.0% |
| West Indians | 0.1 /100 | #271 | Tragic 86.9% |
| Trinidadians and Tobagonians | 0.1 /100 | #272 | Tragic 86.9% |
| Immigrants | Jamaica | 0.1 /100 | #273 | Tragic 86.9% |
| Bangladeshis | 0.1 /100 | #274 | Tragic 86.9% |
| Immigrants | Trinidad and Tobago | 0.1 /100 | #275 | Tragic 86.8% |
Demographics Similar to Nicaraguans by High School Diploma
In terms of high school diploma, the demographic groups most similar to Nicaraguans are Central American Indian (84.2%, a difference of 0.10%), Immigrants from Belize (84.2%, a difference of 0.14%), Yuman (84.0%, a difference of 0.14%), Immigrants from Caribbean (84.3%, a difference of 0.21%), and Belizean (84.3%, a difference of 0.26%).
| Demographics | Rating | Rank | High School Diploma |
| Immigrants | Ecuador | 0.0 /100 | #313 | Tragic 84.8% |
| Yaqui | 0.0 /100 | #314 | Tragic 84.7% |
| Puerto Ricans | 0.0 /100 | #315 | Tragic 84.7% |
| Belizeans | 0.0 /100 | #316 | Tragic 84.3% |
| Immigrants | Caribbean | 0.0 /100 | #317 | Tragic 84.3% |
| Immigrants | Belize | 0.0 /100 | #318 | Tragic 84.2% |
| Central American Indians | 0.0 /100 | #319 | Tragic 84.2% |
| Nicaraguans | 0.0 /100 | #320 | Tragic 84.1% |
| Yuman | 0.0 /100 | #321 | Tragic 84.0% |
| Lumbee | 0.0 /100 | #322 | Tragic 83.6% |
| Immigrants | Cuba | 0.0 /100 | #323 | Tragic 83.5% |
| Immigrants | Cabo Verde | 0.0 /100 | #324 | Tragic 83.3% |
| Immigrants | Nicaragua | 0.0 /100 | #325 | Tragic 83.1% |
| Mexican American Indians | 0.0 /100 | #326 | Tragic 83.0% |
| Hondurans | 0.0 /100 | #327 | Tragic 83.0% |