Belizean vs Immigrants from Uganda 3rd Grade
COMPARE
Belizean
Immigrants from Uganda
3rd Grade
3rd Grade Comparison
Belizeans
Immigrants from Uganda
96.6%
3RD GRADE
0.0/ 100
METRIC RATING
314th/ 347
METRIC RANK
97.7%
3RD GRADE
27.4/ 100
METRIC RATING
194th/ 347
METRIC RANK
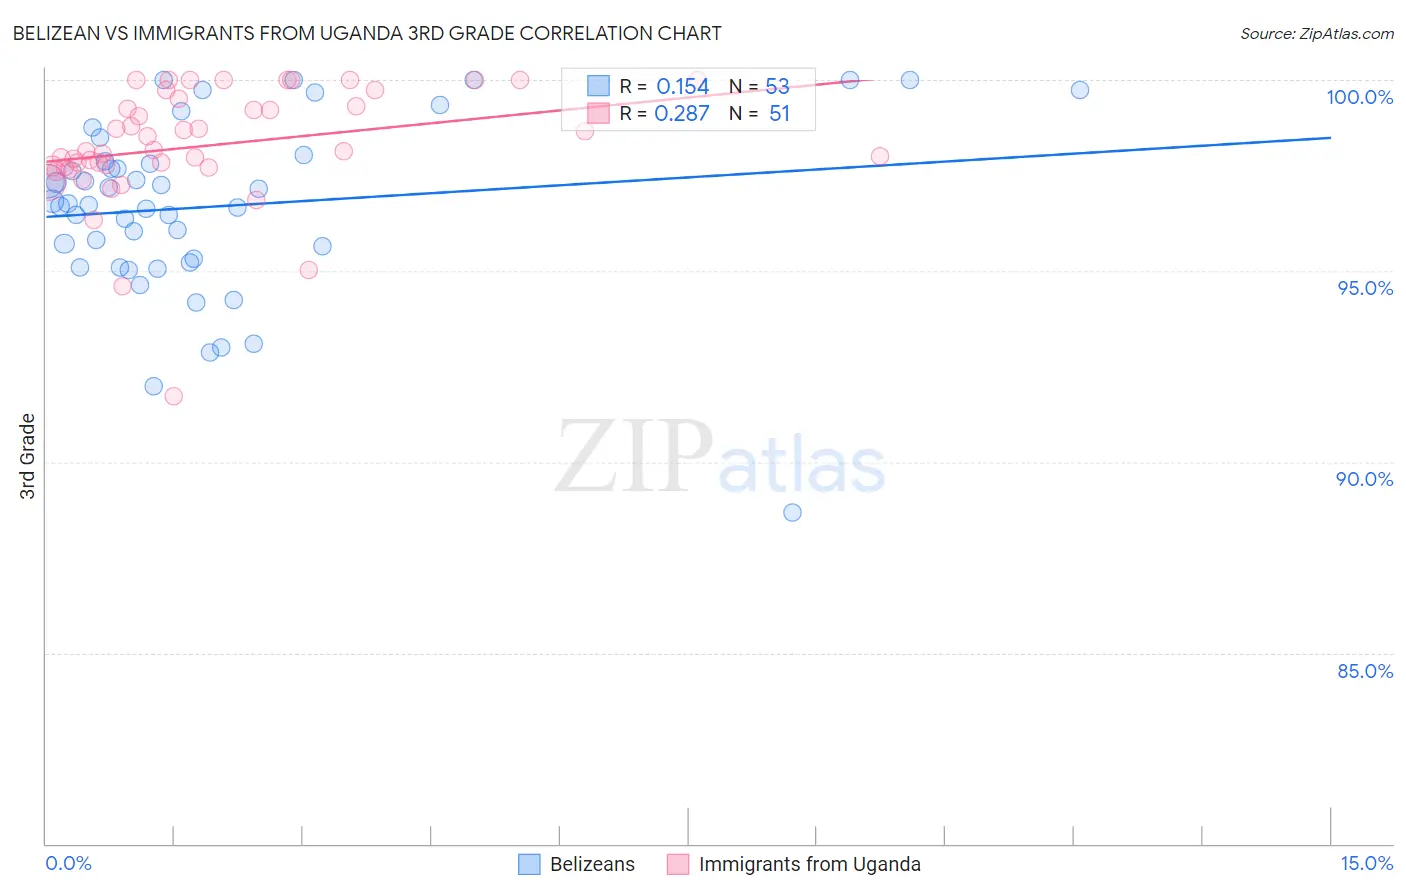
Belizean vs Immigrants from Uganda 3rd Grade Correlation Chart
The statistical analysis conducted on geographies consisting of 144,224,236 people shows a poor positive correlation between the proportion of Belizeans and percentage of population with at least 3rd grade education in the United States with a correlation coefficient (R) of 0.154 and weighted average of 96.6%. Similarly, the statistical analysis conducted on geographies consisting of 125,908,537 people shows a weak positive correlation between the proportion of Immigrants from Uganda and percentage of population with at least 3rd grade education in the United States with a correlation coefficient (R) of 0.287 and weighted average of 97.7%, a difference of 1.1%.
3rd Grade Correlation Summary
| Measurement | Belizean | Immigrants from Uganda |
| Minimum | 88.7% | 91.7% |
| Maximum | 100.0% | 100.0% |
| Range | 11.3% | 8.3% |
| Mean | 96.7% | 98.3% |
| Median | 96.8% | 98.1% |
| Interquartile 25% (IQ1) | 95.3% | 97.7% |
| Interquartile 75% (IQ3) | 98.0% | 99.5% |
| Interquartile Range (IQR) | 2.7% | 1.8% |
| Standard Deviation (Sample) | 2.3% | 1.6% |
| Standard Deviation (Population) | 2.3% | 1.5% |
Similar Demographics by 3rd Grade
Demographics Similar to Belizeans by 3rd Grade
In terms of 3rd grade, the demographic groups most similar to Belizeans are Immigrants from Ecuador (96.6%, a difference of 0.0%), Immigrants from Laos (96.6%, a difference of 0.010%), Immigrants from the Azores (96.6%, a difference of 0.010%), Immigrants from Burma/Myanmar (96.6%, a difference of 0.020%), and Immigrants from Guyana (96.6%, a difference of 0.030%).
| Demographics | Rating | Rank | 3rd Grade |
| Nicaraguans | 0.0 /100 | #307 | Tragic 96.7% |
| Immigrants | Haiti | 0.0 /100 | #308 | Tragic 96.7% |
| Sri Lankans | 0.0 /100 | #309 | Tragic 96.7% |
| Cape Verdeans | 0.0 /100 | #310 | Tragic 96.6% |
| Immigrants | Guyana | 0.0 /100 | #311 | Tragic 96.6% |
| Immigrants | Laos | 0.0 /100 | #312 | Tragic 96.6% |
| Immigrants | Ecuador | 0.0 /100 | #313 | Tragic 96.6% |
| Belizeans | 0.0 /100 | #314 | Tragic 96.6% |
| Immigrants | Azores | 0.0 /100 | #315 | Tragic 96.6% |
| Immigrants | Burma/Myanmar | 0.0 /100 | #316 | Tragic 96.6% |
| Immigrants | Bangladesh | 0.0 /100 | #317 | Tragic 96.6% |
| Hispanics or Latinos | 0.0 /100 | #318 | Tragic 96.5% |
| Vietnamese | 0.0 /100 | #319 | Tragic 96.5% |
| Immigrants | Nicaragua | 0.0 /100 | #320 | Tragic 96.5% |
| Indonesians | 0.0 /100 | #321 | Tragic 96.5% |
Demographics Similar to Immigrants from Uganda by 3rd Grade
In terms of 3rd grade, the demographic groups most similar to Immigrants from Uganda are Immigrants from Kenya (97.7%, a difference of 0.0%), Immigrants from Egypt (97.7%, a difference of 0.0%), Black/African American (97.7%, a difference of 0.010%), Mongolian (97.7%, a difference of 0.010%), and Paraguayan (97.7%, a difference of 0.010%).
| Demographics | Rating | Rank | 3rd Grade |
| Natives/Alaskans | 35.2 /100 | #187 | Fair 97.7% |
| Immigrants | Taiwan | 34.2 /100 | #188 | Fair 97.7% |
| Pakistanis | 34.2 /100 | #189 | Fair 97.7% |
| Panamanians | 31.5 /100 | #190 | Fair 97.7% |
| Blacks/African Americans | 29.6 /100 | #191 | Fair 97.7% |
| Mongolians | 29.1 /100 | #192 | Fair 97.7% |
| Immigrants | Kenya | 28.2 /100 | #193 | Fair 97.7% |
| Immigrants | Uganda | 27.4 /100 | #194 | Fair 97.7% |
| Immigrants | Egypt | 26.8 /100 | #195 | Fair 97.7% |
| Paraguayans | 26.2 /100 | #196 | Fair 97.7% |
| Hawaiians | 25.7 /100 | #197 | Fair 97.7% |
| Guamanians/Chamorros | 23.6 /100 | #198 | Fair 97.7% |
| Immigrants | Ukraine | 22.7 /100 | #199 | Fair 97.7% |
| Immigrants | Albania | 22.6 /100 | #200 | Fair 97.7% |
| Immigrants | Lebanon | 21.7 /100 | #201 | Fair 97.7% |