Belizean vs Costa Rican Unemployment Among Ages 55 to 59 years
COMPARE
Belizean
Costa Rican
Unemployment Among Ages 55 to 59 years
Unemployment Among Ages 55 to 59 years Comparison
Belizeans
Costa Ricans
5.6%
UNEMPLOYMENT AMONG AGES 55 TO 59 YEARS
0.0/ 100
METRIC RATING
310th/ 347
METRIC RANK
5.0%
UNEMPLOYMENT AMONG AGES 55 TO 59 YEARS
4.4/ 100
METRIC RATING
225th/ 347
METRIC RANK
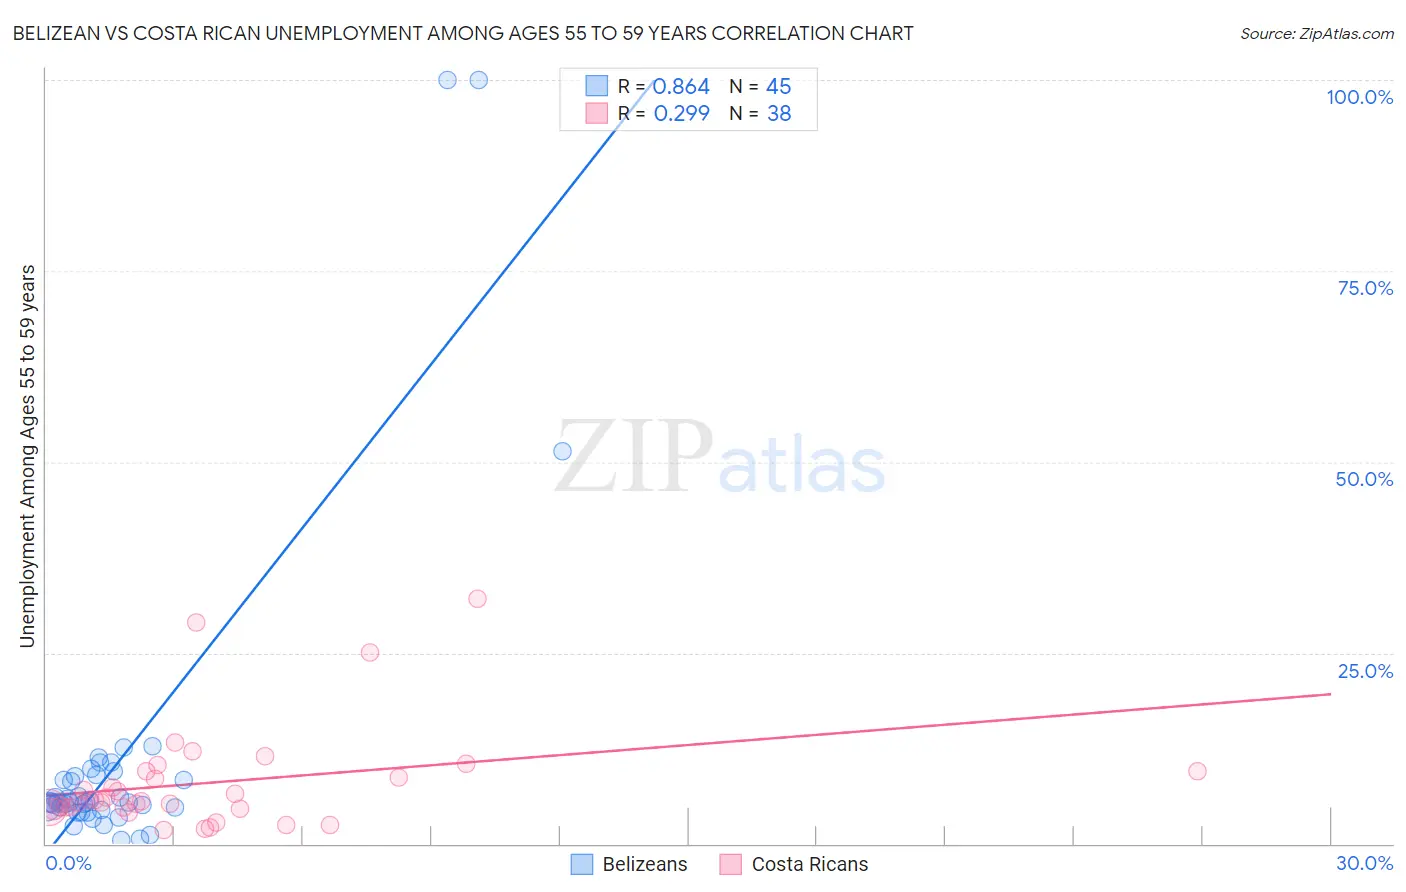
Belizean vs Costa Rican Unemployment Among Ages 55 to 59 years Correlation Chart
The statistical analysis conducted on geographies consisting of 141,169,321 people shows a very strong positive correlation between the proportion of Belizeans and unemployment rate among population between the ages 55 and 59 in the United States with a correlation coefficient (R) of 0.864 and weighted average of 5.6%. Similarly, the statistical analysis conducted on geographies consisting of 243,507,911 people shows a weak positive correlation between the proportion of Costa Ricans and unemployment rate among population between the ages 55 and 59 in the United States with a correlation coefficient (R) of 0.299 and weighted average of 5.0%, a difference of 13.0%.
Unemployment Among Ages 55 to 59 years Correlation Summary
| Measurement | Belizean | Costa Rican |
| Minimum | 0.57% | 1.9% |
| Maximum | 100.0% | 32.1% |
| Range | 99.4% | 30.2% |
| Mean | 11.2% | 8.0% |
| Median | 5.5% | 5.7% |
| Interquartile 25% (IQ1) | 4.5% | 4.7% |
| Interquartile 75% (IQ3) | 8.9% | 9.5% |
| Interquartile Range (IQR) | 4.3% | 4.8% |
| Standard Deviation (Sample) | 20.7% | 6.8% |
| Standard Deviation (Population) | 20.5% | 6.7% |
Similar Demographics by Unemployment Among Ages 55 to 59 years
Demographics Similar to Belizeans by Unemployment Among Ages 55 to 59 years
In terms of unemployment among ages 55 to 59 years, the demographic groups most similar to Belizeans are Houma (5.6%, a difference of 0.18%), Ecuadorian (5.6%, a difference of 0.39%), Nepalese (5.6%, a difference of 0.44%), Central American Indian (5.6%, a difference of 0.58%), and Tlingit-Haida (5.7%, a difference of 0.87%).
| Demographics | Rating | Rank | Unemployment Among Ages 55 to 59 years |
| Marshallese | 0.0 /100 | #303 | Tragic 5.5% |
| Blacks/African Americans | 0.0 /100 | #304 | Tragic 5.5% |
| Immigrants | Portugal | 0.0 /100 | #305 | Tragic 5.5% |
| Immigrants | Cabo Verde | 0.0 /100 | #306 | Tragic 5.5% |
| Immigrants | Belize | 0.0 /100 | #307 | Tragic 5.5% |
| Spanish American Indians | 0.0 /100 | #308 | Tragic 5.6% |
| Nepalese | 0.0 /100 | #309 | Tragic 5.6% |
| Belizeans | 0.0 /100 | #310 | Tragic 5.6% |
| Houma | 0.0 /100 | #311 | Tragic 5.6% |
| Ecuadorians | 0.0 /100 | #312 | Tragic 5.6% |
| Central American Indians | 0.0 /100 | #313 | Tragic 5.6% |
| Tlingit-Haida | 0.0 /100 | #314 | Tragic 5.7% |
| Guyanese | 0.0 /100 | #315 | Tragic 5.7% |
| Immigrants | Ecuador | 0.0 /100 | #316 | Tragic 5.7% |
| Hmong | 0.0 /100 | #317 | Tragic 5.7% |
Demographics Similar to Costa Ricans by Unemployment Among Ages 55 to 59 years
In terms of unemployment among ages 55 to 59 years, the demographic groups most similar to Costa Ricans are Subsaharan African (5.0%, a difference of 0.010%), Immigrants from China (5.0%, a difference of 0.050%), Immigrants from Ireland (5.0%, a difference of 0.090%), Spanish (5.0%, a difference of 0.15%), and Immigrants from Iran (5.0%, a difference of 0.18%).
| Demographics | Rating | Rank | Unemployment Among Ages 55 to 59 years |
| Immigrants | Austria | 8.0 /100 | #218 | Tragic 4.9% |
| Immigrants | Nigeria | 8.0 /100 | #219 | Tragic 4.9% |
| Indians (Asian) | 7.6 /100 | #220 | Tragic 4.9% |
| Nigerians | 7.5 /100 | #221 | Tragic 4.9% |
| Spanish | 5.1 /100 | #222 | Tragic 5.0% |
| Immigrants | Ireland | 4.8 /100 | #223 | Tragic 5.0% |
| Sub-Saharan Africans | 4.4 /100 | #224 | Tragic 5.0% |
| Costa Ricans | 4.4 /100 | #225 | Tragic 5.0% |
| Immigrants | China | 4.2 /100 | #226 | Tragic 5.0% |
| Immigrants | Iran | 3.7 /100 | #227 | Tragic 5.0% |
| Immigrants | Liberia | 3.2 /100 | #228 | Tragic 5.0% |
| Immigrants | Western Asia | 3.0 /100 | #229 | Tragic 5.0% |
| Immigrants | Syria | 2.7 /100 | #230 | Tragic 5.0% |
| Cherokee | 2.6 /100 | #231 | Tragic 5.0% |
| Albanians | 2.5 /100 | #232 | Tragic 5.0% |