Belgian vs Israeli GED/Equivalency

COMPARE

Belgian
Race
Ancestry
AfghanAfricanAlaska NativeAlaskan AthabascanAlbanianAleutAlsatianAmericanApacheArabArapahoArgentineanArmenianAssyrian/Chaldean/SyriacAustralianAustrianBahamianBangladeshiBarbadianBasqueBelgianBelizeanBermudanBhutaneseBlackfeetBolivianBrazilianBritishBritish West IndianBulgarianBurmeseCajunCambodianCanadianCape VerdeanCarpatho RusynCelticCentral AmericanCentral American IndianCherokeeCheyenneChickasawChileanChineseChippewaChoctawColombianColvilleComancheCosta RicanCreeCreekCroatianCrowCubanCypriotCzechCzechoslovakianDanishDelawareDominicanDutchDutch West IndianEastern EuropeanEcuadorianEgyptianEnglishEstonianEthiopianEuropeanFijianFilipinoFinnishFrenchFrench American IndianFrench CanadianGermanGerman RussianGhanaianGreekGuamanian/ChamorroGuatemalanGuyaneseHaitianHmongHonduranHopiHoumaHungarianIcelanderIndian (Asian)IndonesianInupiatIranianIraqiIrishIroquoisItalianJamaicanJapaneseJordanianKenyanKiowaKoreanLaotianLatvianLebaneseLiberianLithuanianLumbeeLuxembourgerMacedonianMalaysianMalteseMarshalleseMenomineeMexicanMexican American IndianMongolianMoroccanNative HawaiianNavajoNepaleseNew ZealanderNicaraguanNigerianNorthern EuropeanNorwegianOkinawanOsageOttawaPaiutePakistaniPalestinianPanamanianParaguayanPennsylvania GermanPeruvianPimaPolishPortuguesePotawatomiPuebloPuerto RicanPuget Sound SalishRomanianRussianSalvadoranSamoanScandinavianScotch-IrishScottishSeminoleSenegaleseSerbianShoshoneSierra LeoneanSiouxSlavicSlovakSloveneSomaliSouth AfricanSouth AmericanSouth American IndianSoviet UnionSpaniardSpanishSpanish AmericanSpanish American IndianSri LankanSubsaharan AfricanSudaneseSwedishSwissSyrianTaiwaneseThaiTlingit-HaidaTohono O'OdhamTonganTrinidadian and TobagonianTsimshianTurkishU.S. Virgin IslanderUgandanUkrainianUruguayanUteVenezuelanVietnameseWelshWest IndianYakamaYaquiYugoslavianYumanYup'ikZimbabwean
Immigration
NonimmigrantsImmigrantsAfghanistanAfricaAlbaniaArgentinaArmeniaAsiaAustraliaAustriaBahamasBangladeshBarbadosBelarusBelgiumBelizeBoliviaBosnia and HerzegovinaBrazilBulgariaBurma/MyanmarCabo VerdeCambodiaCameroonCanadaCaribbeanCentral AmericaChileChinaColombiaCongoCosta RicaCroatiaCubaCzechoslovakiaDenmarkDominicaDominican RepublicEastern AfricaEastern AsiaEastern EuropeEcuadorEgyptEl SalvadorEnglandEritreaEthiopiaEuropeFijiFranceGermanyGhanaGreeceGrenadaGuatemalaGuyanaHaitiHondurasHong KongHungaryIndiaIndonesiaIranIraqIrelandIsraelItalyJamaicaJapanJordanKazakhstanKenyaKoreaKuwaitLaosLatin AmericaLatviaLebanonLiberiaLithuaniaMalaysiaMexicoMicronesiaMiddle AfricaMoldovaMoroccoNepalNetherlandsNicaraguaNigeriaNorth AmericaNorth MacedoniaNorthern AfricaNorthern EuropeNorwayOceaniaPakistanPanamaPeruPhilippinesPolandPortugalRomaniaRussiaSaudi ArabiaScotlandSenegalSerbiaSierra LeoneSingaporeSomaliaSouth AfricaSouth AmericaSouth Central AsiaSouth Eastern AsiaSouthern EuropeSpainSri LankaSt. Vincent and the GrenadinesSudanSwedenSwitzerlandSyriaTaiwanThailandTrinidad and TobagoTurkeyUgandaUkraineUruguayUzbekistanVenezuelaVietnamWest IndiesWestern AfricaWestern AsiaWestern EuropeYemenZaireZimbabweAzores
Israeli
Race
Ancestry
AfghanAfricanAlaska NativeAlaskan AthabascanAlbanianAleutAlsatianAmericanApacheArabArapahoArgentineanArmenianAssyrian/Chaldean/SyriacAustralianAustrianBahamianBangladeshiBarbadianBasqueBelizeanBermudanBhutaneseBlackfeetBolivianBrazilianBritishBritish West IndianBulgarianBurmeseCajunCambodianCanadianCape VerdeanCarpatho RusynCelticCentral AmericanCentral American IndianCherokeeCheyenneChickasawChileanChineseChippewaChoctawColombianColvilleComancheCosta RicanCreeCreekCroatianCrowCubanCypriotCzechCzechoslovakianDanishDelawareDominicanDutchDutch West IndianEastern EuropeanEcuadorianEgyptianEnglishEstonianEthiopianEuropeanFijianFilipinoFinnishFrenchFrench American IndianFrench CanadianGermanGerman RussianGhanaianGreekGuamanian/ChamorroGuatemalanGuyaneseHaitianHmongHonduranHopiHoumaHungarianIcelanderIndian (Asian)IndonesianInupiatIranianIraqiIrishIroquoisIsraeliItalianJamaicanJapaneseJordanianKenyanKiowaKoreanLaotianLatvianLebaneseLiberianLithuanianLumbeeLuxembourgerMacedonianMalaysianMalteseMarshalleseMenomineeMexicanMexican American IndianMongolianMoroccanNative HawaiianNavajoNepaleseNew ZealanderNicaraguanNigerianNorthern EuropeanNorwegianOkinawanOsageOttawaPaiutePakistaniPalestinianPanamanianParaguayanPennsylvania GermanPeruvianPimaPolishPortuguesePotawatomiPuebloPuerto RicanPuget Sound SalishRomanianRussianSalvadoranSamoanScandinavianScotch-IrishScottishSeminoleSenegaleseSerbianShoshoneSierra LeoneanSiouxSlavicSlovakSloveneSomaliSouth AfricanSouth AmericanSouth American IndianSoviet UnionSpaniardSpanishSpanish AmericanSpanish American IndianSri LankanSubsaharan AfricanSudaneseSwedishSwissSyrianTaiwaneseThaiTlingit-HaidaTohono O'OdhamTonganTrinidadian and TobagonianTsimshianTurkishU.S. Virgin IslanderUgandanUkrainianUruguayanUteVenezuelanVietnameseWelshWest IndianYakamaYaquiYugoslavianYumanYup'ikZimbabwean
Immigration
NonimmigrantsImmigrantsAfghanistanAfricaAlbaniaArgentinaArmeniaAsiaAustraliaAustriaBahamasBangladeshBarbadosBelarusBelgiumBelizeBoliviaBosnia and HerzegovinaBrazilBulgariaBurma/MyanmarCabo VerdeCambodiaCameroonCanadaCaribbeanCentral AmericaChileChinaColombiaCongoCosta RicaCroatiaCubaCzechoslovakiaDenmarkDominicaDominican RepublicEastern AfricaEastern AsiaEastern EuropeEcuadorEgyptEl SalvadorEnglandEritreaEthiopiaEuropeFijiFranceGermanyGhanaGreeceGrenadaGuatemalaGuyanaHaitiHondurasHong KongHungaryIndiaIndonesiaIranIraqIrelandIsraelItalyJamaicaJapanJordanKazakhstanKenyaKoreaKuwaitLaosLatin AmericaLatviaLebanonLiberiaLithuaniaMalaysiaMexicoMicronesiaMiddle AfricaMoldovaMoroccoNepalNetherlandsNicaraguaNigeriaNorth AmericaNorth MacedoniaNorthern AfricaNorthern EuropeNorwayOceaniaPakistanPanamaPeruPhilippinesPolandPortugalRomaniaRussiaSaudi ArabiaScotlandSenegalSerbiaSierra LeoneSingaporeSomaliaSouth AfricaSouth AmericaSouth Central AsiaSouth Eastern AsiaSouthern EuropeSpainSri LankaSt. Vincent and the GrenadinesSudanSwedenSwitzerlandSyriaTaiwanThailandTrinidad and TobagoTurkeyUgandaUkraineUruguayUzbekistanVenezuelaVietnamWest IndiesWestern AfricaWestern AsiaWestern EuropeYemenZaireZimbabweAzores
GED/Equivalency
Income
Poverty
Unemployment
Labor Participation
Family Structure
Vehicle Availability
Education Level
Disability

GED/Equivalency Comparison

Belgians

Israelis

Exceptional
Exceptional
87.7%
GED/EQUIVALENCY
98.8/ 100
METRIC RATING
73rd/ 347
METRIC RANK
87.4%
GED/EQUIVALENCY
97.8/ 100
METRIC RATING
92nd/ 347
METRIC RANK

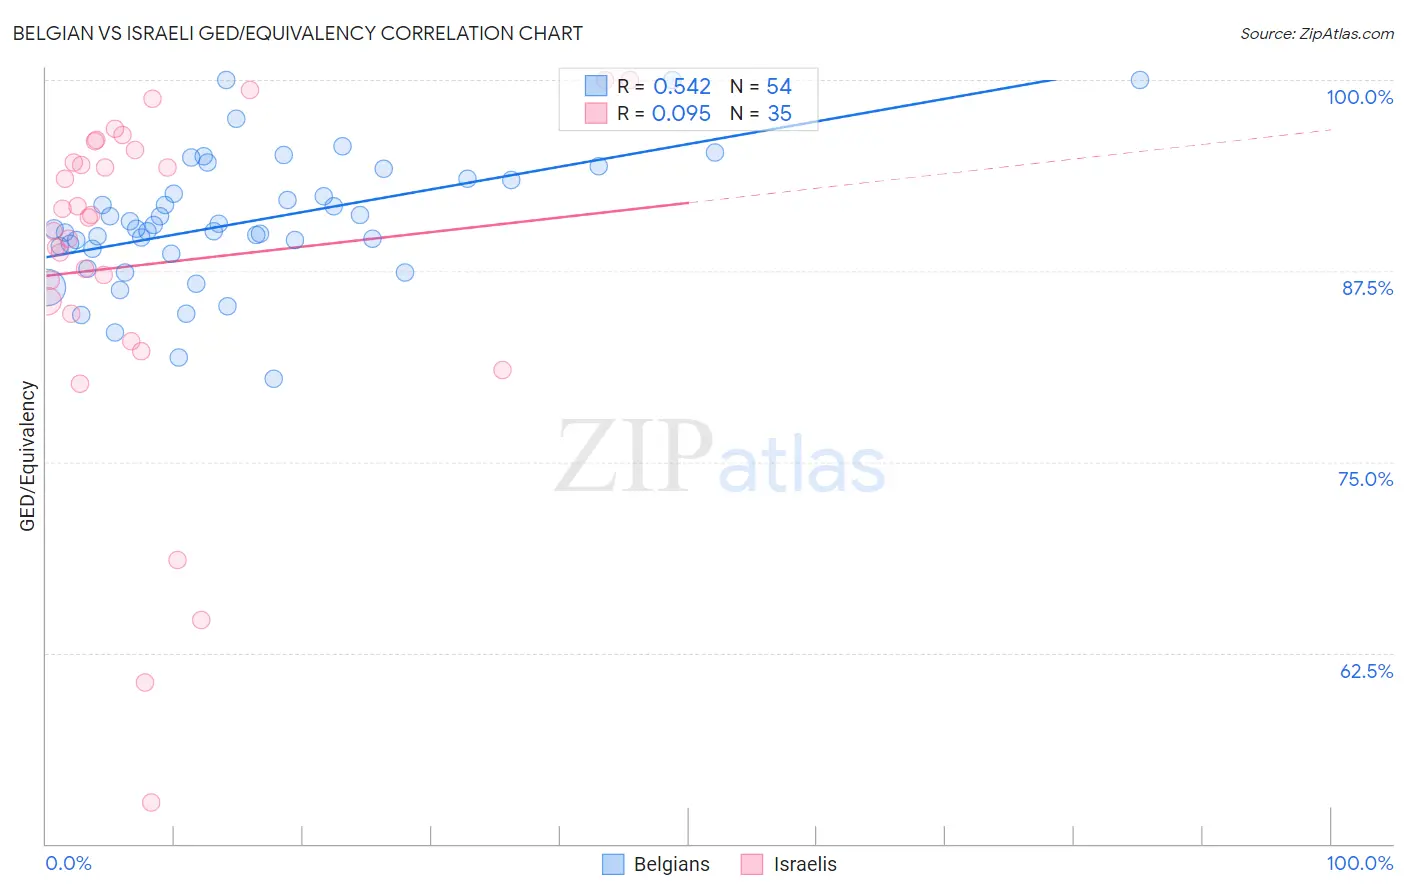
Belgian vs Israeli GED/Equivalency Correlation Chart

The statistical analysis conducted on geographies consisting of 356,019,518 people shows a substantial positive correlation between the proportion of Belgians and percentage of population with at least ged/equivalency education in the United States with a correlation coefficient (R) of 0.542 and weighted average of 87.7%. Similarly, the statistical analysis conducted on geographies consisting of 211,219,980 people shows a slight positive correlation between the proportion of Israelis and percentage of population with at least ged/equivalency education in the United States with a correlation coefficient (R) of 0.095 and weighted average of 87.4%, a difference of 0.31%.
Belgian vs Israeli GED/Equivalency

GED/Equivalency Correlation Summary

MeasurementBelgianIsraeli
Minimum80.5%52.7%
Maximum100.0%100.0%
Range19.5%47.3%
Mean90.7%87.9%
Median90.2%91.0%
Interquartile 25% (IQ1)88.9%84.7%
Interquartile 75% (IQ3)93.5%95.4%
Interquartile Range (IQR)4.5%10.7%
Standard Deviation (Sample)4.2%11.1%
Standard Deviation (Population)4.1%11.0%

Demographics Similar to Belgians and Israelis by GED/Equivalency

In terms of ged/equivalency, the demographic groups most similar to Belgians are Immigrants from Moldova (87.7%, a difference of 0.010%), Immigrants from Kuwait (87.7%, a difference of 0.020%), Scottish (87.7%, a difference of 0.030%), Immigrants from Serbia (87.7%, a difference of 0.050%), and Slavic (87.7%, a difference of 0.050%). Similarly, the demographic groups most similar to Israelis are Immigrants from Eastern Asia (87.4%, a difference of 0.010%), Hungarian (87.4%, a difference of 0.020%), Welsh (87.4%, a difference of 0.020%), Immigrants from Norway (87.5%, a difference of 0.060%), and Immigrants from Europe (87.5%, a difference of 0.070%).
DemographicsRating | RankGED/Equivalency
Immigrants | Moldova
98.8
/100
|
#72
Exceptional
87.7%
Belgians
98.8
/100
|
#73
Exceptional
87.7%
Immigrants | Kuwait
98.8
/100
|
#74
Exceptional
87.7%
Scottish
98.7
/100
|
#75
Exceptional
87.7%
Immigrants | Serbia
98.7
/100
|
#76
Exceptional
87.7%
Slavs
98.7
/100
|
#77
Exceptional
87.7%
Irish
98.6
/100
|
#78
Exceptional
87.6%
English
98.6
/100
|
#79
Exceptional
87.6%
Immigrants | England
98.5
/100
|
#80
Exceptional
87.6%
Immigrants | Sri Lanka
98.3
/100
|
#81
Exceptional
87.5%
Romanians
98.3
/100
|
#82
Exceptional
87.5%
South Africans
98.3
/100
|
#83
Exceptional
87.5%
Immigrants | Romania
98.1
/100
|
#84
Exceptional
87.5%
Dutch
98.1
/100
|
#85
Exceptional
87.5%
Immigrants | Europe
98.1
/100
|
#86
Exceptional
87.5%
Native Hawaiians
98.1
/100
|
#87
Exceptional
87.5%
Immigrants | Norway
98.1
/100
|
#88
Exceptional
87.5%
Hungarians
97.9
/100
|
#89
Exceptional
87.4%
Welsh
97.9
/100
|
#90
Exceptional
87.4%
Immigrants | Eastern Asia
97.9
/100
|
#91
Exceptional
87.4%
Israelis
97.8
/100
|
#92
Exceptional
87.4%