Belgian vs Immigrants from Dominica GED/Equivalency
COMPARE
Belgian
Immigrants from Dominica
GED/Equivalency
GED/Equivalency Comparison
Belgians
Immigrants from Dominica
87.7%
GED/EQUIVALENCY
98.8/ 100
METRIC RATING
73rd/ 347
METRIC RANK
81.1%
GED/EQUIVALENCY
0.0/ 100
METRIC RATING
307th/ 347
METRIC RANK
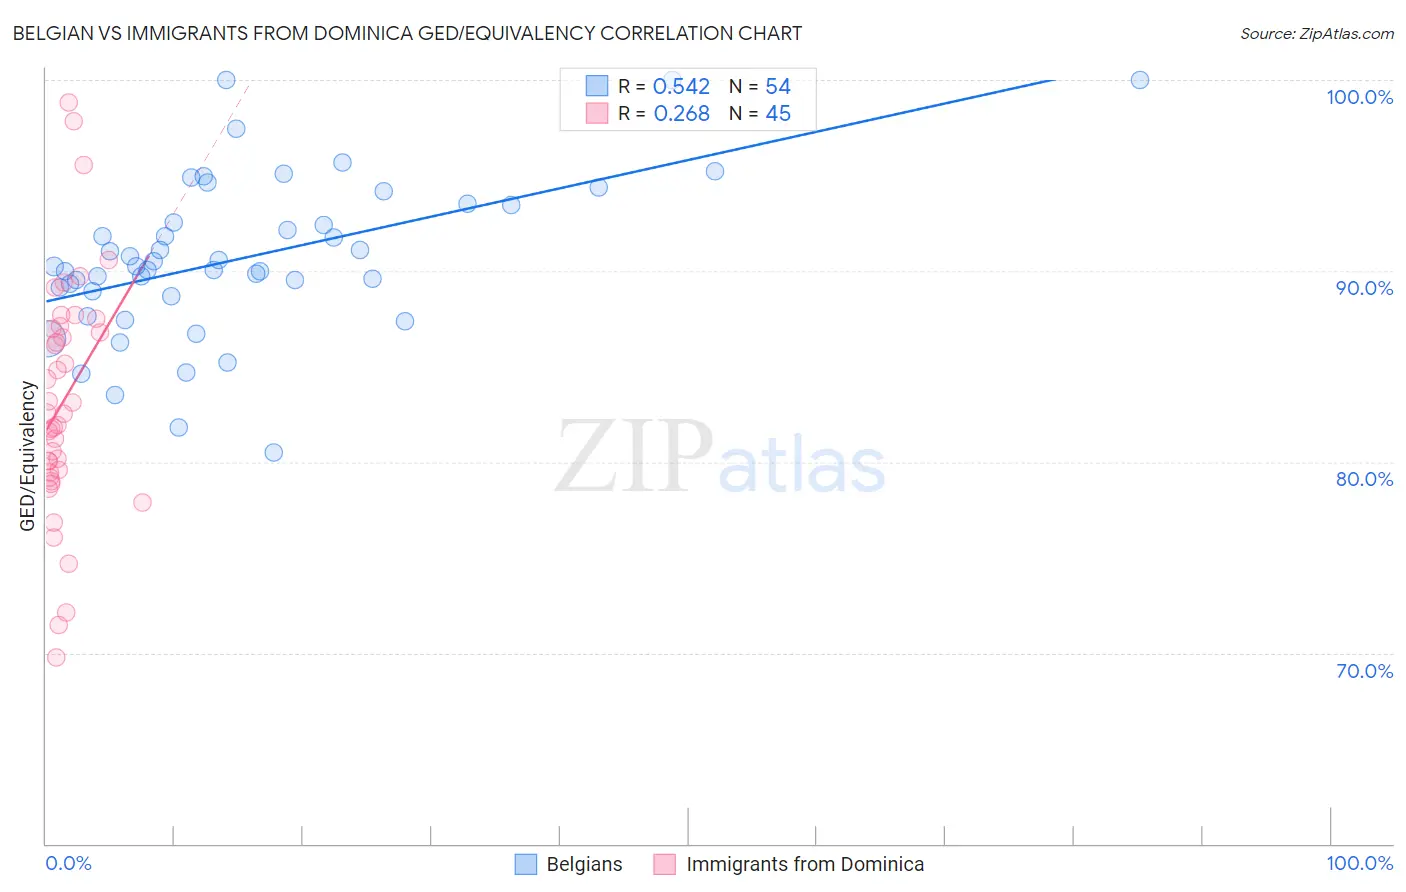
Belgian vs Immigrants from Dominica GED/Equivalency Correlation Chart
The statistical analysis conducted on geographies consisting of 356,019,518 people shows a substantial positive correlation between the proportion of Belgians and percentage of population with at least ged/equivalency education in the United States with a correlation coefficient (R) of 0.542 and weighted average of 87.7%. Similarly, the statistical analysis conducted on geographies consisting of 83,794,115 people shows a weak positive correlation between the proportion of Immigrants from Dominica and percentage of population with at least ged/equivalency education in the United States with a correlation coefficient (R) of 0.268 and weighted average of 81.1%, a difference of 8.1%.
GED/Equivalency Correlation Summary
| Measurement | Belgian | Immigrants from Dominica |
| Minimum | 80.5% | 69.7% |
| Maximum | 100.0% | 98.8% |
| Range | 19.5% | 29.1% |
| Mean | 90.7% | 83.1% |
| Median | 90.2% | 82.5% |
| Interquartile 25% (IQ1) | 88.9% | 79.3% |
| Interquartile 75% (IQ3) | 93.5% | 87.0% |
| Interquartile Range (IQR) | 4.5% | 7.8% |
| Standard Deviation (Sample) | 4.2% | 6.2% |
| Standard Deviation (Population) | 4.1% | 6.2% |
Similar Demographics by GED/Equivalency
Demographics Similar to Belgians by GED/Equivalency
In terms of ged/equivalency, the demographic groups most similar to Belgians are Ukrainian (87.7%, a difference of 0.010%), Austrian (87.7%, a difference of 0.010%), Immigrants from Moldova (87.7%, a difference of 0.010%), Immigrants from Kuwait (87.7%, a difference of 0.020%), and Scottish (87.7%, a difference of 0.030%).
| Demographics | Rating | Rank | GED/Equivalency |
| Immigrants | Bulgaria | 99.1 /100 | #66 | Exceptional 87.8% |
| British | 99.1 /100 | #67 | Exceptional 87.8% |
| Immigrants | France | 99.1 /100 | #68 | Exceptional 87.8% |
| Immigrants | Saudi Arabia | 99.0 /100 | #69 | Exceptional 87.8% |
| Ukrainians | 98.8 /100 | #70 | Exceptional 87.7% |
| Austrians | 98.8 /100 | #71 | Exceptional 87.7% |
| Immigrants | Moldova | 98.8 /100 | #72 | Exceptional 87.7% |
| Belgians | 98.8 /100 | #73 | Exceptional 87.7% |
| Immigrants | Kuwait | 98.8 /100 | #74 | Exceptional 87.7% |
| Scottish | 98.7 /100 | #75 | Exceptional 87.7% |
| Immigrants | Serbia | 98.7 /100 | #76 | Exceptional 87.7% |
| Slavs | 98.7 /100 | #77 | Exceptional 87.7% |
| Irish | 98.6 /100 | #78 | Exceptional 87.6% |
| English | 98.6 /100 | #79 | Exceptional 87.6% |
| Immigrants | England | 98.5 /100 | #80 | Exceptional 87.6% |
Demographics Similar to Immigrants from Dominica by GED/Equivalency
In terms of ged/equivalency, the demographic groups most similar to Immigrants from Dominica are Puerto Rican (81.1%, a difference of 0.10%), Guyanese (81.3%, a difference of 0.17%), Immigrants from Ecuador (81.0%, a difference of 0.18%), Immigrants from Grenada (81.3%, a difference of 0.19%), and Immigrants from Guyana (81.0%, a difference of 0.25%).
| Demographics | Rating | Rank | GED/Equivalency |
| Fijians | 0.0 /100 | #300 | Tragic 81.6% |
| Dutch West Indians | 0.0 /100 | #301 | Tragic 81.6% |
| Immigrants | Haiti | 0.0 /100 | #302 | Tragic 81.6% |
| Immigrants | Portugal | 0.0 /100 | #303 | Tragic 81.6% |
| Navajo | 0.0 /100 | #304 | Tragic 81.5% |
| Immigrants | Grenada | 0.0 /100 | #305 | Tragic 81.3% |
| Guyanese | 0.0 /100 | #306 | Tragic 81.3% |
| Immigrants | Dominica | 0.0 /100 | #307 | Tragic 81.1% |
| Puerto Ricans | 0.0 /100 | #308 | Tragic 81.1% |
| Immigrants | Ecuador | 0.0 /100 | #309 | Tragic 81.0% |
| Immigrants | Guyana | 0.0 /100 | #310 | Tragic 81.0% |
| Natives/Alaskans | 0.0 /100 | #311 | Tragic 80.9% |
| Nicaraguans | 0.0 /100 | #312 | Tragic 80.9% |
| Cape Verdeans | 0.0 /100 | #313 | Tragic 80.9% |
| Belizeans | 0.0 /100 | #314 | Tragic 80.9% |