Austrian vs Sudanese No Schooling Completed
COMPARE
Austrian
Sudanese
No Schooling Completed
No Schooling Completed Comparison
Austrians
Sudanese
1.6%
NO SCHOOLING COMPLETED
99.8/ 100
METRIC RATING
57th/ 347
METRIC RANK
2.3%
NO SCHOOLING COMPLETED
4.1/ 100
METRIC RATING
225th/ 347
METRIC RANK
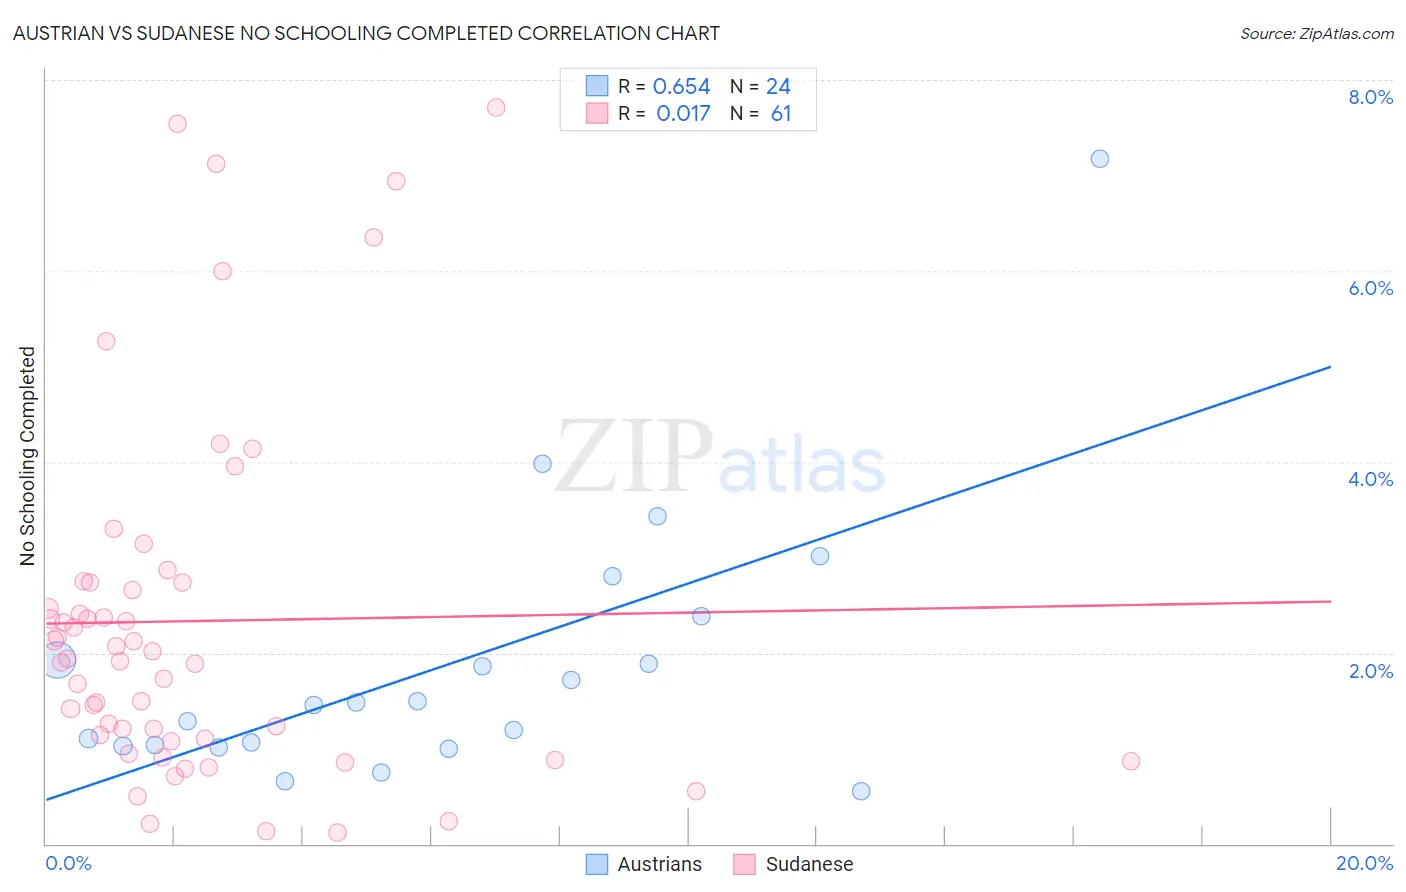
Austrian vs Sudanese No Schooling Completed Correlation Chart
The statistical analysis conducted on geographies consisting of 443,991,525 people shows a significant positive correlation between the proportion of Austrians and percentage of population with no schooling in the United States with a correlation coefficient (R) of 0.654 and weighted average of 1.6%. Similarly, the statistical analysis conducted on geographies consisting of 109,854,543 people shows no correlation between the proportion of Sudanese and percentage of population with no schooling in the United States with a correlation coefficient (R) of 0.017 and weighted average of 2.3%, a difference of 40.4%.
No Schooling Completed Correlation Summary
| Measurement | Austrian | Sudanese |
| Minimum | 0.55% | 0.12% |
| Maximum | 7.2% | 7.7% |
| Range | 6.6% | 7.6% |
| Mean | 1.9% | 2.3% |
| Median | 1.5% | 1.9% |
| Interquartile 25% (IQ1) | 1.0% | 1.1% |
| Interquartile 75% (IQ3) | 2.2% | 2.7% |
| Interquartile Range (IQR) | 1.1% | 1.6% |
| Standard Deviation (Sample) | 1.4% | 1.9% |
| Standard Deviation (Population) | 1.4% | 1.8% |
Similar Demographics by No Schooling Completed
Demographics Similar to Austrians by No Schooling Completed
In terms of no schooling completed, the demographic groups most similar to Austrians are Kiowa (1.6%, a difference of 0.16%), Slavic (1.7%, a difference of 0.23%), Greek (1.6%, a difference of 0.31%), Immigrants from North America (1.6%, a difference of 0.31%), and American (1.7%, a difference of 0.35%).
| Demographics | Rating | Rank | No Schooling Completed |
| Celtics | 99.9 /100 | #50 | Exceptional 1.6% |
| Chippewa | 99.8 /100 | #51 | Exceptional 1.6% |
| Immigrants | Canada | 99.8 /100 | #52 | Exceptional 1.6% |
| Creek | 99.8 /100 | #53 | Exceptional 1.6% |
| Crow | 99.8 /100 | #54 | Exceptional 1.6% |
| Greeks | 99.8 /100 | #55 | Exceptional 1.6% |
| Immigrants | North America | 99.8 /100 | #56 | Exceptional 1.6% |
| Austrians | 99.8 /100 | #57 | Exceptional 1.6% |
| Kiowa | 99.8 /100 | #58 | Exceptional 1.6% |
| Slavs | 99.8 /100 | #59 | Exceptional 1.7% |
| Americans | 99.8 /100 | #60 | Exceptional 1.7% |
| Tsimshian | 99.8 /100 | #61 | Exceptional 1.7% |
| Immigrants | Northern Europe | 99.8 /100 | #62 | Exceptional 1.7% |
| Russians | 99.8 /100 | #63 | Exceptional 1.7% |
| New Zealanders | 99.7 /100 | #64 | Exceptional 1.7% |
Demographics Similar to Sudanese by No Schooling Completed
In terms of no schooling completed, the demographic groups most similar to Sudanese are Tohono O'odham (2.3%, a difference of 0.0%), Sierra Leonean (2.3%, a difference of 0.010%), Immigrants from Uganda (2.3%, a difference of 0.070%), Immigrants from Lebanon (2.3%, a difference of 0.29%), and U.S. Virgin Islander (2.3%, a difference of 0.36%).
| Demographics | Rating | Rank | No Schooling Completed |
| Immigrants | Nepal | 6.4 /100 | #218 | Tragic 2.3% |
| Senegalese | 5.6 /100 | #219 | Tragic 2.3% |
| Immigrants | Costa Rica | 5.1 /100 | #220 | Tragic 2.3% |
| Immigrants | Sudan | 5.0 /100 | #221 | Tragic 2.3% |
| Sub-Saharan Africans | 4.7 /100 | #222 | Tragic 2.3% |
| Immigrants | Lebanon | 4.5 /100 | #223 | Tragic 2.3% |
| Tohono O'odham | 4.1 /100 | #224 | Tragic 2.3% |
| Sudanese | 4.1 /100 | #225 | Tragic 2.3% |
| Sierra Leoneans | 4.1 /100 | #226 | Tragic 2.3% |
| Immigrants | Uganda | 4.0 /100 | #227 | Tragic 2.3% |
| U.S. Virgin Islanders | 3.7 /100 | #228 | Tragic 2.3% |
| Immigrants | Pakistan | 3.6 /100 | #229 | Tragic 2.3% |
| Puerto Ricans | 3.4 /100 | #230 | Tragic 2.3% |
| Immigrants | Uruguay | 3.4 /100 | #231 | Tragic 2.3% |
| Colombians | 3.2 /100 | #232 | Tragic 2.3% |