Australian vs Immigrants from Middle Africa 3rd Grade
COMPARE
Australian
Immigrants from Middle Africa
3rd Grade
3rd Grade Comparison
Australians
Immigrants from Middle Africa
98.3%
3RD GRADE
99.8/ 100
METRIC RATING
51st/ 347
METRIC RANK
97.4%
3RD GRADE
0.9/ 100
METRIC RATING
250th/ 347
METRIC RANK
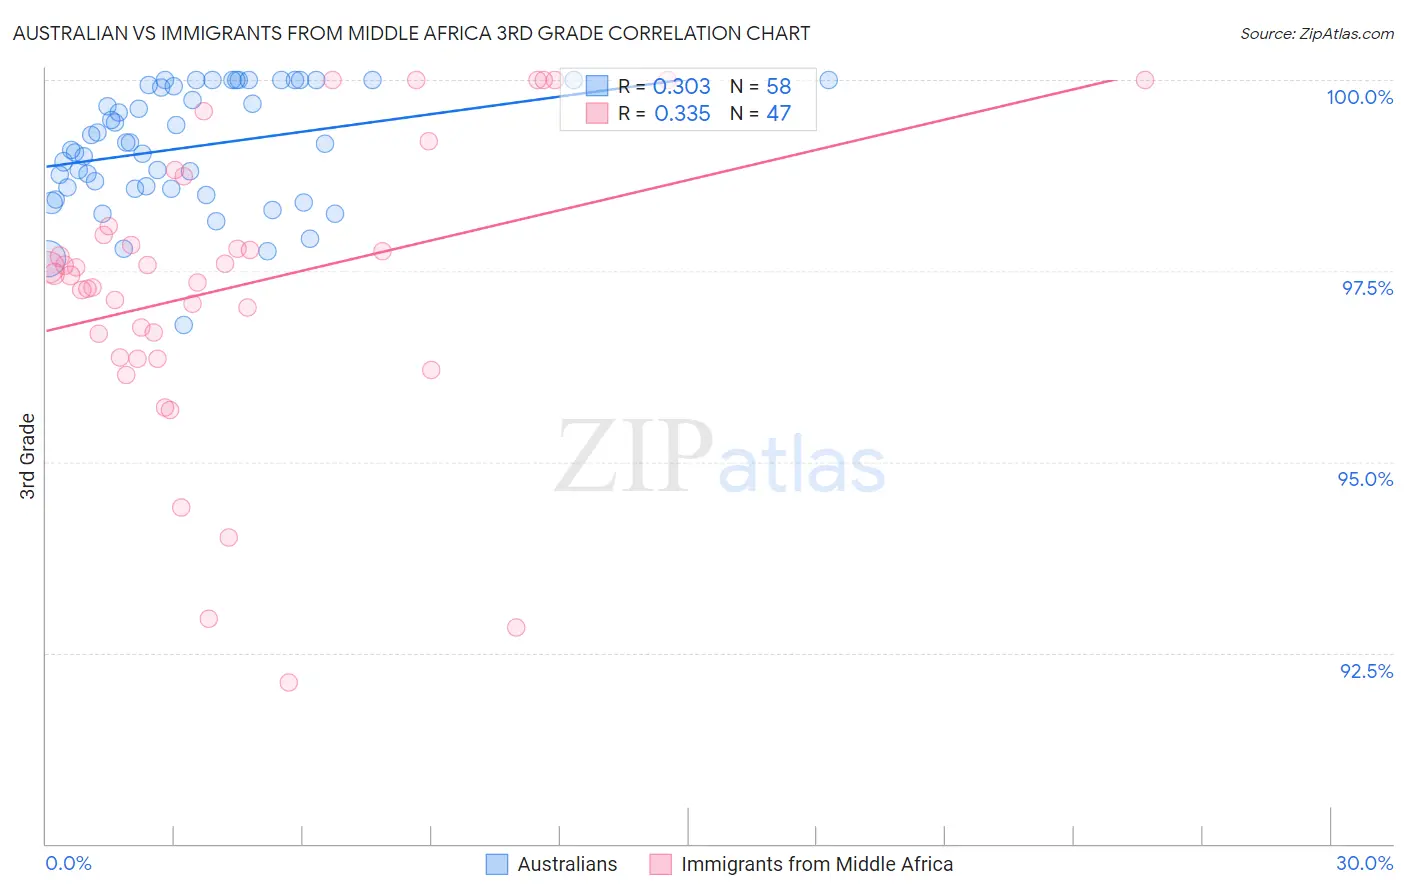
Australian vs Immigrants from Middle Africa 3rd Grade Correlation Chart
The statistical analysis conducted on geographies consisting of 224,153,392 people shows a mild positive correlation between the proportion of Australians and percentage of population with at least 3rd grade education in the United States with a correlation coefficient (R) of 0.303 and weighted average of 98.3%. Similarly, the statistical analysis conducted on geographies consisting of 202,721,852 people shows a mild positive correlation between the proportion of Immigrants from Middle Africa and percentage of population with at least 3rd grade education in the United States with a correlation coefficient (R) of 0.335 and weighted average of 97.4%, a difference of 0.93%.
3rd Grade Correlation Summary
| Measurement | Australian | Immigrants from Middle Africa |
| Minimum | 96.8% | 92.1% |
| Maximum | 100.0% | 100.0% |
| Range | 3.2% | 7.9% |
| Mean | 99.1% | 97.3% |
| Median | 99.2% | 97.5% |
| Interquartile 25% (IQ1) | 98.6% | 96.4% |
| Interquartile 75% (IQ3) | 99.9% | 98.1% |
| Interquartile Range (IQR) | 1.4% | 1.7% |
| Standard Deviation (Sample) | 0.77% | 1.9% |
| Standard Deviation (Population) | 0.77% | 1.9% |
Similar Demographics by 3rd Grade
Demographics Similar to Australians by 3rd Grade
In terms of 3rd grade, the demographic groups most similar to Australians are Estonian (98.3%, a difference of 0.0%), Celtic (98.3%, a difference of 0.0%), White/Caucasian (98.3%, a difference of 0.0%), Immigrants from Scotland (98.3%, a difference of 0.010%), and Ottawa (98.3%, a difference of 0.020%).
| Demographics | Rating | Rank | 3rd Grade |
| Hungarians | 99.9 /100 | #44 | Exceptional 98.3% |
| Native Hawaiians | 99.9 /100 | #45 | Exceptional 98.3% |
| Ottawa | 99.8 /100 | #46 | Exceptional 98.3% |
| Czechoslovakians | 99.8 /100 | #47 | Exceptional 98.3% |
| Lumbee | 99.8 /100 | #48 | Exceptional 98.3% |
| Estonians | 99.8 /100 | #49 | Exceptional 98.3% |
| Celtics | 99.8 /100 | #50 | Exceptional 98.3% |
| Australians | 99.8 /100 | #51 | Exceptional 98.3% |
| Whites/Caucasians | 99.8 /100 | #52 | Exceptional 98.3% |
| Immigrants | Scotland | 99.8 /100 | #53 | Exceptional 98.3% |
| Bulgarians | 99.8 /100 | #54 | Exceptional 98.3% |
| Americans | 99.8 /100 | #55 | Exceptional 98.3% |
| Austrians | 99.8 /100 | #56 | Exceptional 98.3% |
| Slavs | 99.7 /100 | #57 | Exceptional 98.3% |
| Greeks | 99.7 /100 | #58 | Exceptional 98.3% |
Demographics Similar to Immigrants from Middle Africa by 3rd Grade
In terms of 3rd grade, the demographic groups most similar to Immigrants from Middle Africa are Immigrants from Asia (97.4%, a difference of 0.0%), Immigrants from Senegal (97.4%, a difference of 0.010%), Assyrian/Chaldean/Syriac (97.4%, a difference of 0.010%), Immigrants from Eastern Africa (97.4%, a difference of 0.010%), and South American (97.4%, a difference of 0.010%).
| Demographics | Rating | Rank | 3rd Grade |
| Indians (Asian) | 1.3 /100 | #243 | Tragic 97.4% |
| Asians | 1.1 /100 | #244 | Tragic 97.4% |
| Ethiopians | 1.1 /100 | #245 | Tragic 97.4% |
| Immigrants | Senegal | 1.0 /100 | #246 | Tragic 97.4% |
| Assyrians/Chaldeans/Syriacs | 1.0 /100 | #247 | Tragic 97.4% |
| Immigrants | Eastern Africa | 0.9 /100 | #248 | Tragic 97.4% |
| South Americans | 0.9 /100 | #249 | Tragic 97.4% |
| Immigrants | Middle Africa | 0.9 /100 | #250 | Tragic 97.4% |
| Immigrants | Asia | 0.8 /100 | #251 | Tragic 97.4% |
| Peruvians | 0.8 /100 | #252 | Tragic 97.4% |
| Immigrants | Africa | 0.8 /100 | #253 | Tragic 97.4% |
| Jamaicans | 0.7 /100 | #254 | Tragic 97.4% |
| Bolivians | 0.6 /100 | #255 | Tragic 97.3% |
| Immigrants | Congo | 0.6 /100 | #256 | Tragic 97.3% |
| Immigrants | Colombia | 0.5 /100 | #257 | Tragic 97.3% |