Immigrants from Bolivia vs Immigrants from Middle Africa 3rd Grade
COMPARE
Immigrants from Bolivia
Immigrants from Middle Africa
3rd Grade
3rd Grade Comparison
Immigrants from Bolivia
Immigrants from Middle Africa
97.2%
3RD GRADE
0.1/ 100
METRIC RATING
276th/ 347
METRIC RANK
97.4%
3RD GRADE
0.9/ 100
METRIC RATING
250th/ 347
METRIC RANK
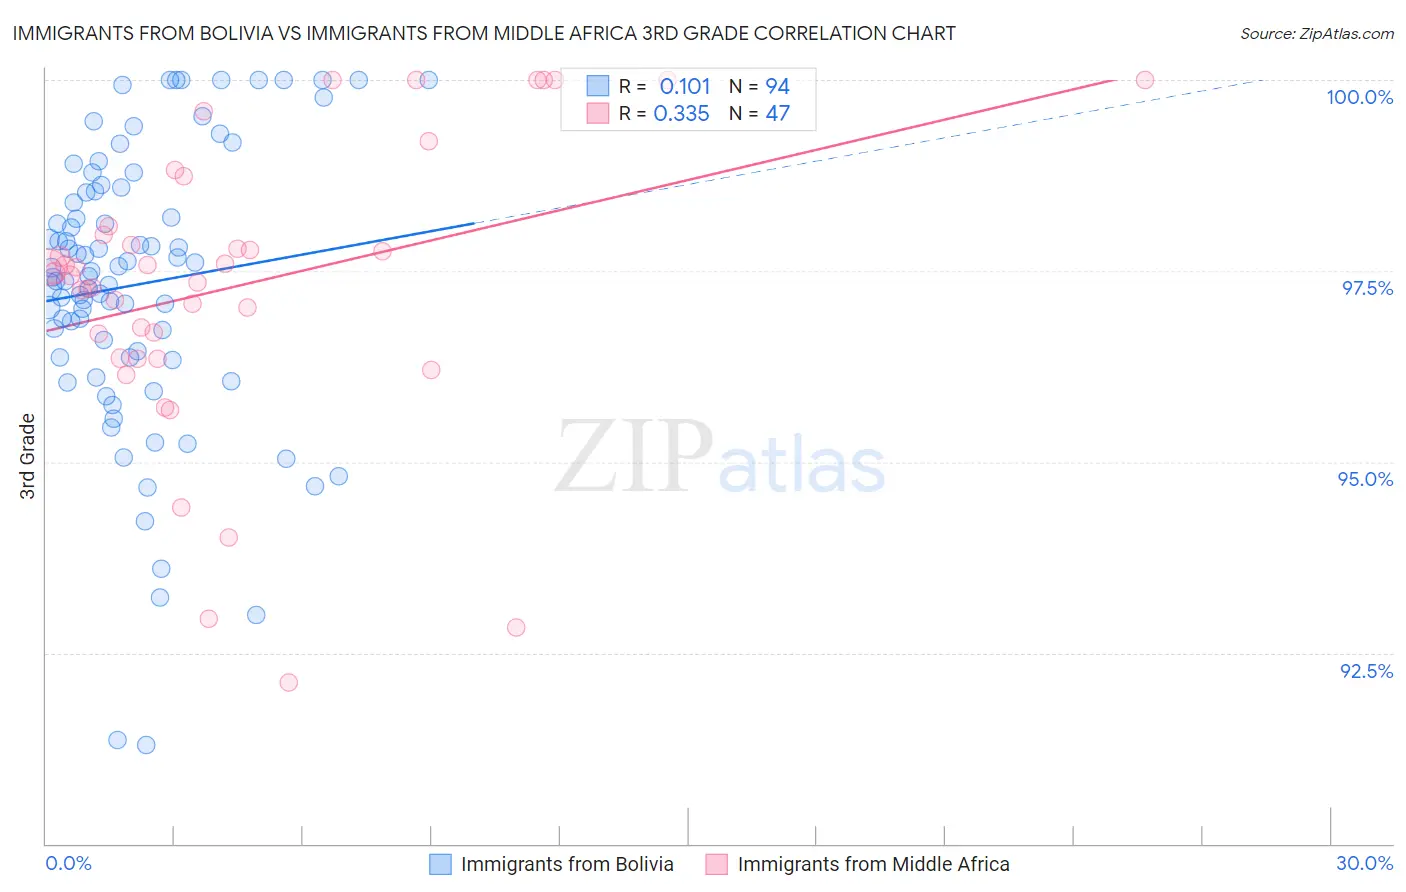
Immigrants from Bolivia vs Immigrants from Middle Africa 3rd Grade Correlation Chart
The statistical analysis conducted on geographies consisting of 158,719,812 people shows a poor positive correlation between the proportion of Immigrants from Bolivia and percentage of population with at least 3rd grade education in the United States with a correlation coefficient (R) of 0.101 and weighted average of 97.2%. Similarly, the statistical analysis conducted on geographies consisting of 202,721,852 people shows a mild positive correlation between the proportion of Immigrants from Middle Africa and percentage of population with at least 3rd grade education in the United States with a correlation coefficient (R) of 0.335 and weighted average of 97.4%, a difference of 0.20%.
3rd Grade Correlation Summary
| Measurement | Immigrants from Bolivia | Immigrants from Middle Africa |
| Minimum | 91.3% | 92.1% |
| Maximum | 100.0% | 100.0% |
| Range | 8.7% | 7.9% |
| Mean | 97.3% | 97.3% |
| Median | 97.5% | 97.5% |
| Interquartile 25% (IQ1) | 96.4% | 96.4% |
| Interquartile 75% (IQ3) | 98.5% | 98.1% |
| Interquartile Range (IQR) | 2.2% | 1.7% |
| Standard Deviation (Sample) | 1.9% | 1.9% |
| Standard Deviation (Population) | 1.8% | 1.9% |
Similar Demographics by 3rd Grade
Demographics Similar to Immigrants from Bolivia by 3rd Grade
In terms of 3rd grade, the demographic groups most similar to Immigrants from Bolivia are Trinidadian and Tobagonian (97.2%, a difference of 0.0%), Immigrants from Western Africa (97.2%, a difference of 0.0%), Immigrants from Philippines (97.2%, a difference of 0.010%), Immigrants from Ghana (97.2%, a difference of 0.010%), and Immigrants from Uzbekistan (97.2%, a difference of 0.020%).
| Demographics | Rating | Rank | 3rd Grade |
| Fijians | 0.2 /100 | #269 | Tragic 97.3% |
| Immigrants | China | 0.2 /100 | #270 | Tragic 97.2% |
| Puerto Ricans | 0.2 /100 | #271 | Tragic 97.2% |
| Ghanaians | 0.1 /100 | #272 | Tragic 97.2% |
| Immigrants | Peru | 0.1 /100 | #273 | Tragic 97.2% |
| Immigrants | Cameroon | 0.1 /100 | #274 | Tragic 97.2% |
| Immigrants | Uzbekistan | 0.1 /100 | #275 | Tragic 97.2% |
| Immigrants | Bolivia | 0.1 /100 | #276 | Tragic 97.2% |
| Trinidadians and Tobagonians | 0.1 /100 | #277 | Tragic 97.2% |
| Immigrants | Western Africa | 0.1 /100 | #278 | Tragic 97.2% |
| Immigrants | Philippines | 0.1 /100 | #279 | Tragic 97.2% |
| Immigrants | Ghana | 0.1 /100 | #280 | Tragic 97.2% |
| Barbadians | 0.1 /100 | #281 | Tragic 97.2% |
| Afghans | 0.1 /100 | #282 | Tragic 97.1% |
| Houma | 0.1 /100 | #283 | Tragic 97.1% |
Demographics Similar to Immigrants from Middle Africa by 3rd Grade
In terms of 3rd grade, the demographic groups most similar to Immigrants from Middle Africa are Immigrants from Asia (97.4%, a difference of 0.0%), Immigrants from Senegal (97.4%, a difference of 0.010%), Assyrian/Chaldean/Syriac (97.4%, a difference of 0.010%), Immigrants from Eastern Africa (97.4%, a difference of 0.010%), and South American (97.4%, a difference of 0.010%).
| Demographics | Rating | Rank | 3rd Grade |
| Indians (Asian) | 1.3 /100 | #243 | Tragic 97.4% |
| Asians | 1.1 /100 | #244 | Tragic 97.4% |
| Ethiopians | 1.1 /100 | #245 | Tragic 97.4% |
| Immigrants | Senegal | 1.0 /100 | #246 | Tragic 97.4% |
| Assyrians/Chaldeans/Syriacs | 1.0 /100 | #247 | Tragic 97.4% |
| Immigrants | Eastern Africa | 0.9 /100 | #248 | Tragic 97.4% |
| South Americans | 0.9 /100 | #249 | Tragic 97.4% |
| Immigrants | Middle Africa | 0.9 /100 | #250 | Tragic 97.4% |
| Immigrants | Asia | 0.8 /100 | #251 | Tragic 97.4% |
| Peruvians | 0.8 /100 | #252 | Tragic 97.4% |
| Immigrants | Africa | 0.8 /100 | #253 | Tragic 97.4% |
| Jamaicans | 0.7 /100 | #254 | Tragic 97.4% |
| Bolivians | 0.6 /100 | #255 | Tragic 97.3% |
| Immigrants | Congo | 0.6 /100 | #256 | Tragic 97.3% |
| Immigrants | Colombia | 0.5 /100 | #257 | Tragic 97.3% |