Arab vs Native Hawaiian 11th Grade
COMPARE
Arab
Native Hawaiian
11th Grade
11th Grade Comparison
Arabs
Native Hawaiians
92.9%
11TH GRADE
85.4/ 100
METRIC RATING
137th/ 347
METRIC RANK
93.9%
11TH GRADE
99.8/ 100
METRIC RATING
65th/ 347
METRIC RANK
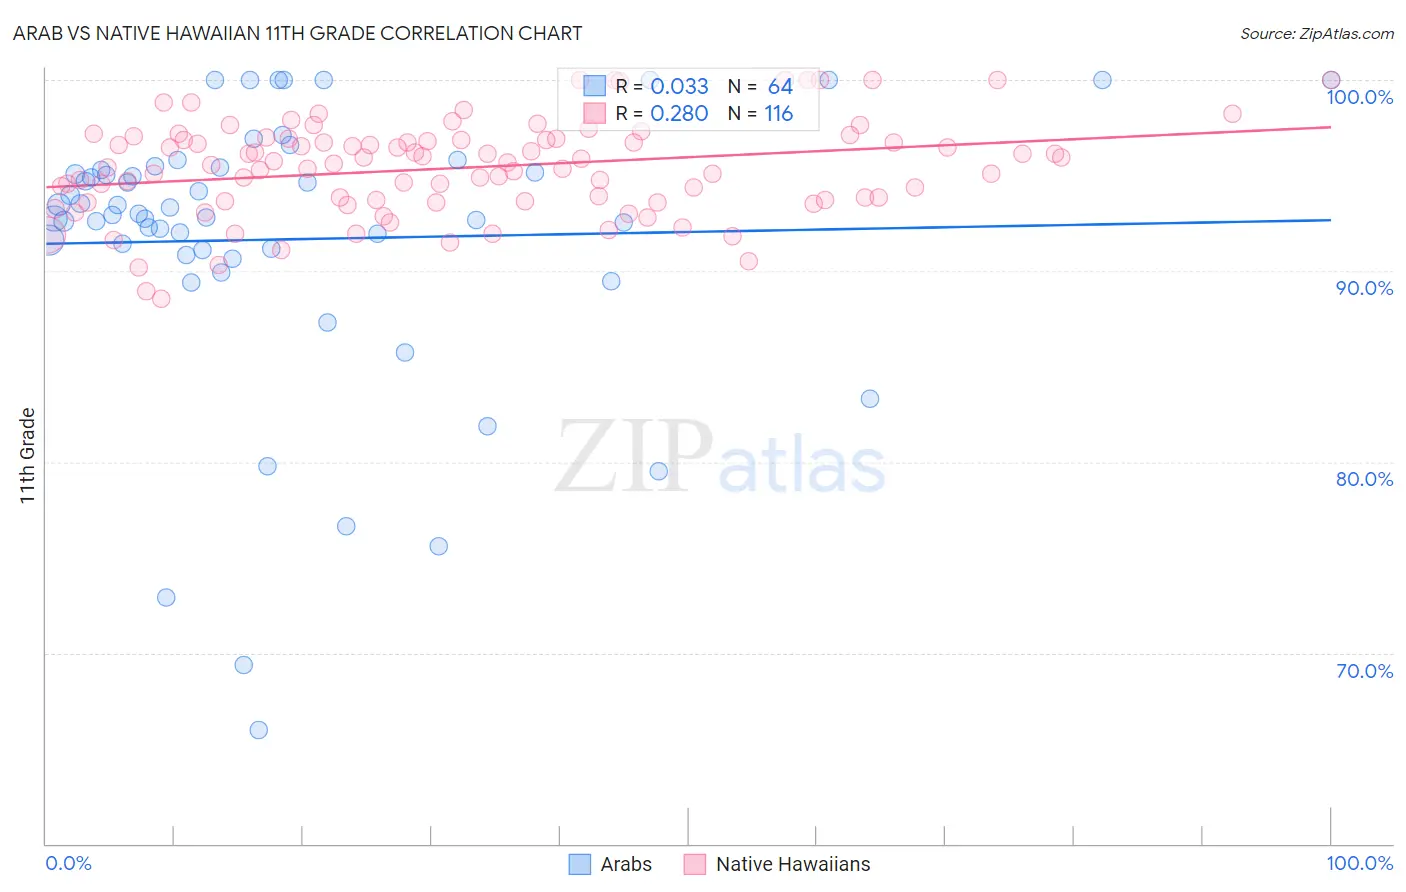
Arab vs Native Hawaiian 11th Grade Correlation Chart
The statistical analysis conducted on geographies consisting of 486,870,847 people shows no correlation between the proportion of Arabs and percentage of population with at least 11th grade education in the United States with a correlation coefficient (R) of 0.033 and weighted average of 92.9%. Similarly, the statistical analysis conducted on geographies consisting of 332,119,254 people shows a weak positive correlation between the proportion of Native Hawaiians and percentage of population with at least 11th grade education in the United States with a correlation coefficient (R) of 0.280 and weighted average of 93.9%, a difference of 1.1%.
11th Grade Correlation Summary
| Measurement | Arab | Native Hawaiian |
| Minimum | 66.0% | 88.5% |
| Maximum | 100.0% | 100.0% |
| Range | 34.0% | 11.5% |
| Mean | 91.7% | 95.4% |
| Median | 93.0% | 95.7% |
| Interquartile 25% (IQ1) | 91.0% | 93.7% |
| Interquartile 75% (IQ3) | 95.3% | 96.9% |
| Interquartile Range (IQR) | 4.4% | 3.2% |
| Standard Deviation (Sample) | 7.4% | 2.5% |
| Standard Deviation (Population) | 7.3% | 2.5% |
Similar Demographics by 11th Grade
Demographics Similar to Arabs by 11th Grade
In terms of 11th grade, the demographic groups most similar to Arabs are Cree (92.9%, a difference of 0.010%), Immigrants from Brazil (92.9%, a difference of 0.010%), Immigrants from Italy (92.9%, a difference of 0.020%), Crow (92.9%, a difference of 0.030%), and Mongolian (93.0%, a difference of 0.040%).
| Demographics | Rating | Rank | 11th Grade |
| Albanians | 89.5 /100 | #130 | Excellent 93.0% |
| Egyptians | 89.5 /100 | #131 | Excellent 93.0% |
| Immigrants | Bosnia and Herzegovina | 89.0 /100 | #132 | Excellent 93.0% |
| Mongolians | 87.6 /100 | #133 | Excellent 93.0% |
| Delaware | 87.3 /100 | #134 | Excellent 93.0% |
| Immigrants | Italy | 86.6 /100 | #135 | Excellent 92.9% |
| Cree | 85.9 /100 | #136 | Excellent 92.9% |
| Arabs | 85.4 /100 | #137 | Excellent 92.9% |
| Immigrants | Brazil | 85.1 /100 | #138 | Excellent 92.9% |
| Crow | 84.1 /100 | #139 | Excellent 92.9% |
| Venezuelans | 83.4 /100 | #140 | Excellent 92.9% |
| Chileans | 83.0 /100 | #141 | Excellent 92.9% |
| Kenyans | 82.0 /100 | #142 | Excellent 92.9% |
| Ugandans | 81.4 /100 | #143 | Excellent 92.9% |
| Assyrians/Chaldeans/Syriacs | 80.5 /100 | #144 | Excellent 92.8% |
Demographics Similar to Native Hawaiians by 11th Grade
In terms of 11th grade, the demographic groups most similar to Native Hawaiians are Immigrants from Sweden (93.9%, a difference of 0.0%), Alaskan Athabascan (93.9%, a difference of 0.020%), Immigrants from Netherlands (93.9%, a difference of 0.020%), Ukrainian (94.0%, a difference of 0.030%), and Zimbabwean (93.9%, a difference of 0.040%).
| Demographics | Rating | Rank | 11th Grade |
| Iranians | 99.9 /100 | #58 | Exceptional 94.0% |
| Bhutanese | 99.8 /100 | #59 | Exceptional 94.0% |
| Okinawans | 99.8 /100 | #60 | Exceptional 94.0% |
| Immigrants | Belgium | 99.8 /100 | #61 | Exceptional 94.0% |
| Austrians | 99.8 /100 | #62 | Exceptional 94.0% |
| Ukrainians | 99.8 /100 | #63 | Exceptional 94.0% |
| Immigrants | Sweden | 99.8 /100 | #64 | Exceptional 93.9% |
| Native Hawaiians | 99.8 /100 | #65 | Exceptional 93.9% |
| Alaskan Athabascans | 99.8 /100 | #66 | Exceptional 93.9% |
| Immigrants | Netherlands | 99.8 /100 | #67 | Exceptional 93.9% |
| Zimbabweans | 99.8 /100 | #68 | Exceptional 93.9% |
| Scotch-Irish | 99.8 /100 | #69 | Exceptional 93.9% |
| Immigrants | England | 99.7 /100 | #70 | Exceptional 93.8% |
| Immigrants | South Africa | 99.7 /100 | #71 | Exceptional 93.8% |
| Immigrants | Japan | 99.7 /100 | #72 | Exceptional 93.8% |