Apache vs Immigrants from Bahamas 1st Grade
COMPARE
Apache
Immigrants from Bahamas
1st Grade
1st Grade Comparison
Apache
Immigrants from Bahamas
98.0%
1ST GRADE
75.2/ 100
METRIC RATING
148th/ 347
METRIC RANK
97.7%
1ST GRADE
8.1/ 100
METRIC RATING
213th/ 347
METRIC RANK
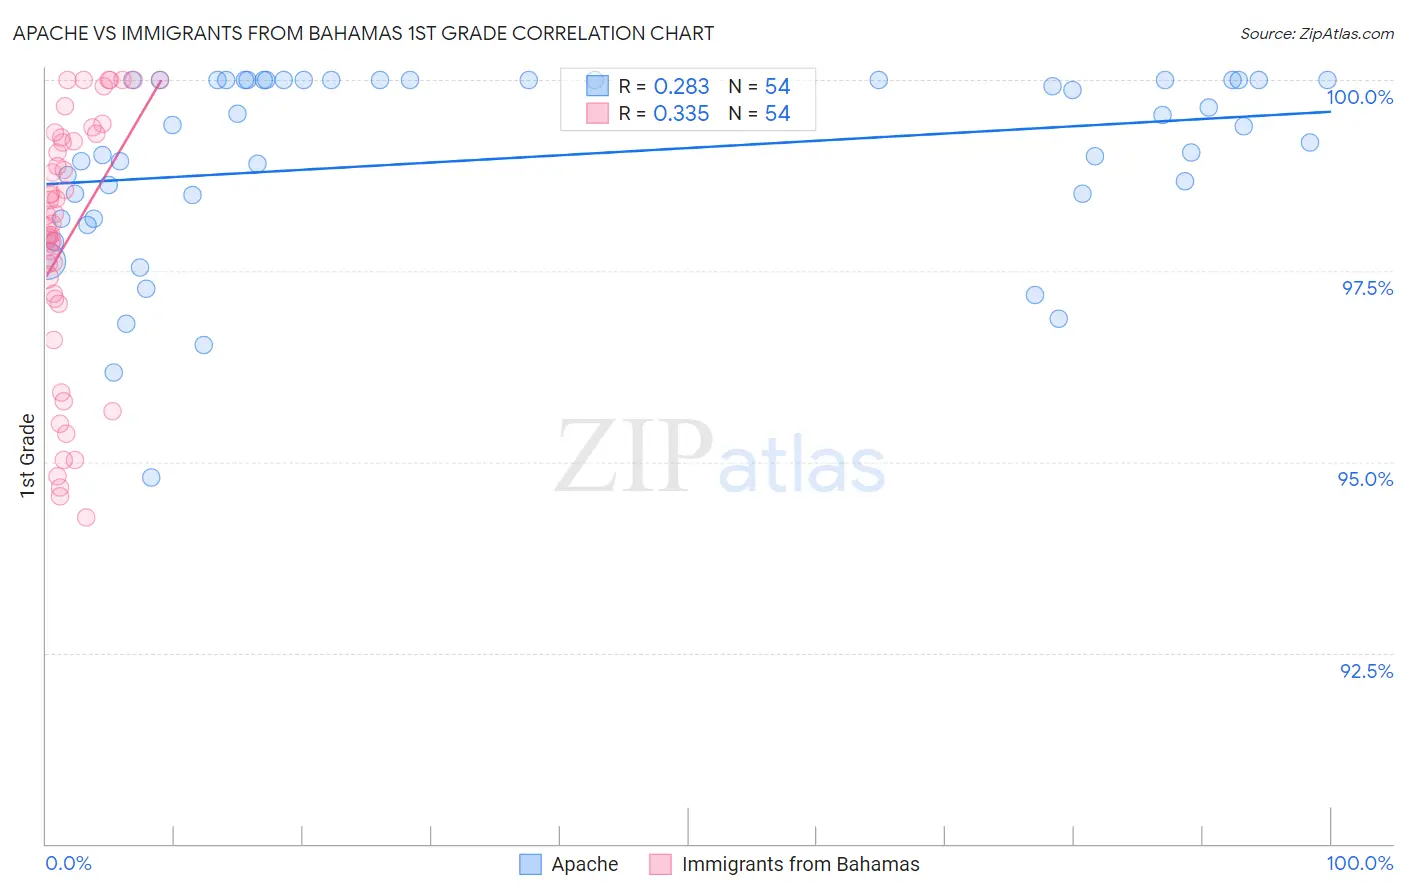
Apache vs Immigrants from Bahamas 1st Grade Correlation Chart
The statistical analysis conducted on geographies consisting of 231,142,814 people shows a weak positive correlation between the proportion of Apache and percentage of population with at least 1st grade education in the United States with a correlation coefficient (R) of 0.283 and weighted average of 98.0%. Similarly, the statistical analysis conducted on geographies consisting of 104,666,627 people shows a mild positive correlation between the proportion of Immigrants from Bahamas and percentage of population with at least 1st grade education in the United States with a correlation coefficient (R) of 0.335 and weighted average of 97.7%, a difference of 0.28%.
1st Grade Correlation Summary
| Measurement | Apache | Immigrants from Bahamas |
| Minimum | 94.8% | 94.3% |
| Maximum | 100.0% | 100.0% |
| Range | 5.2% | 5.7% |
| Mean | 99.0% | 97.9% |
| Median | 99.4% | 98.2% |
| Interquartile 25% (IQ1) | 98.5% | 97.1% |
| Interquartile 75% (IQ3) | 100.0% | 99.2% |
| Interquartile Range (IQR) | 1.5% | 2.1% |
| Standard Deviation (Sample) | 1.2% | 1.7% |
| Standard Deviation (Population) | 1.2% | 1.7% |
Similar Demographics by 1st Grade
Demographics Similar to Apache by 1st Grade
In terms of 1st grade, the demographic groups most similar to Apache are Immigrants from Greece (98.0%, a difference of 0.0%), Immigrants from Israel (98.0%, a difference of 0.010%), Filipino (98.0%, a difference of 0.010%), Jordanian (98.0%, a difference of 0.010%), and Hmong (98.0%, a difference of 0.020%).
| Demographics | Rating | Rank | 1st Grade |
| Immigrants | Turkey | 82.8 /100 | #141 | Excellent 98.0% |
| Marshallese | 82.0 /100 | #142 | Excellent 98.0% |
| Burmese | 81.0 /100 | #143 | Excellent 98.0% |
| Alsatians | 80.9 /100 | #144 | Excellent 98.0% |
| Hmong | 79.0 /100 | #145 | Good 98.0% |
| Immigrants | Israel | 77.8 /100 | #146 | Good 98.0% |
| Filipinos | 77.6 /100 | #147 | Good 98.0% |
| Apache | 75.2 /100 | #148 | Good 98.0% |
| Immigrants | Greece | 74.9 /100 | #149 | Good 98.0% |
| Jordanians | 72.7 /100 | #150 | Good 98.0% |
| Dutch West Indians | 69.8 /100 | #151 | Good 98.0% |
| Immigrants | Moldova | 69.5 /100 | #152 | Good 98.0% |
| Soviet Union | 68.9 /100 | #153 | Good 98.0% |
| Immigrants | Iran | 66.9 /100 | #154 | Good 98.0% |
| Comanche | 66.9 /100 | #155 | Good 98.0% |
Demographics Similar to Immigrants from Bahamas by 1st Grade
In terms of 1st grade, the demographic groups most similar to Immigrants from Bahamas are Moroccan (97.7%, a difference of 0.010%), South American Indian (97.7%, a difference of 0.010%), Bahamian (97.7%, a difference of 0.010%), Uruguayan (97.7%, a difference of 0.010%), and Samoan (97.7%, a difference of 0.010%).
| Demographics | Rating | Rank | 1st Grade |
| Immigrants | Albania | 17.3 /100 | #206 | Poor 97.8% |
| Africans | 16.5 /100 | #207 | Poor 97.8% |
| Immigrants | Northern Africa | 12.0 /100 | #208 | Poor 97.8% |
| Costa Ricans | 11.6 /100 | #209 | Poor 97.8% |
| Immigrants | Oceania | 11.0 /100 | #210 | Poor 97.8% |
| Laotians | 10.3 /100 | #211 | Poor 97.8% |
| Moroccans | 8.7 /100 | #212 | Tragic 97.7% |
| Immigrants | Bahamas | 8.1 /100 | #213 | Tragic 97.7% |
| South American Indians | 7.6 /100 | #214 | Tragic 97.7% |
| Bahamians | 7.5 /100 | #215 | Tragic 97.7% |
| Uruguayans | 7.4 /100 | #216 | Tragic 97.7% |
| Samoans | 6.8 /100 | #217 | Tragic 97.7% |
| Immigrants | Morocco | 5.3 /100 | #218 | Tragic 97.7% |
| Immigrants | Panama | 5.2 /100 | #219 | Tragic 97.7% |
| Tongans | 4.6 /100 | #220 | Tragic 97.7% |