Immigrants from Hong Kong vs Immigrants from South Africa Professional Degree
COMPARE
Immigrants from Hong Kong
Immigrants from South Africa
Professional Degree
Professional Degree Comparison
Immigrants from Hong Kong
Immigrants from South Africa
6.4%
PROFESSIONAL DEGREE
100.0/ 100
METRIC RATING
21st/ 347
METRIC RANK
6.0%
PROFESSIONAL DEGREE
100.0/ 100
METRIC RATING
39th/ 347
METRIC RANK
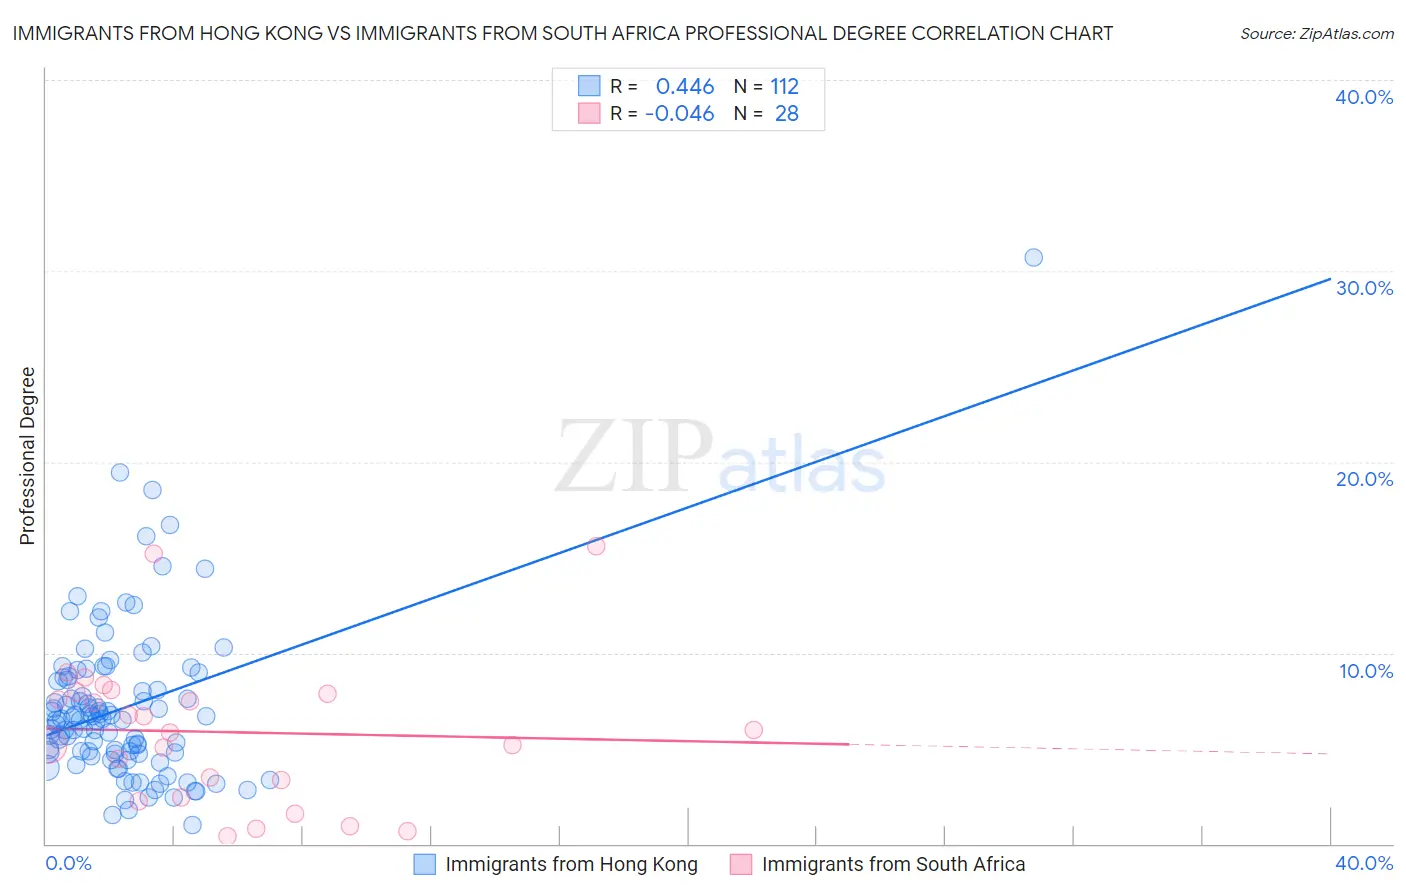
Immigrants from Hong Kong vs Immigrants from South Africa Professional Degree Correlation Chart
The statistical analysis conducted on geographies consisting of 253,893,385 people shows a moderate positive correlation between the proportion of Immigrants from Hong Kong and percentage of population with at least professional degree education in the United States with a correlation coefficient (R) of 0.446 and weighted average of 6.4%. Similarly, the statistical analysis conducted on geographies consisting of 233,136,921 people shows no correlation between the proportion of Immigrants from South Africa and percentage of population with at least professional degree education in the United States with a correlation coefficient (R) of -0.046 and weighted average of 6.0%, a difference of 6.9%.
Professional Degree Correlation Summary
| Measurement | Immigrants from Hong Kong | Immigrants from South Africa |
| Minimum | 0.97% | 0.42% |
| Maximum | 30.7% | 15.5% |
| Range | 29.8% | 15.1% |
| Mean | 7.1% | 5.8% |
| Median | 6.5% | 5.9% |
| Interquartile 25% (IQ1) | 4.8% | 2.9% |
| Interquartile 75% (IQ3) | 8.6% | 7.9% |
| Interquartile Range (IQR) | 3.9% | 5.0% |
| Standard Deviation (Sample) | 4.1% | 3.8% |
| Standard Deviation (Population) | 4.1% | 3.7% |
Demographics Similar to Immigrants from Hong Kong and Immigrants from South Africa by Professional Degree
In terms of professional degree, the demographic groups most similar to Immigrants from Hong Kong are Immigrants from Denmark (6.4%, a difference of 0.22%), Immigrants from Japan (6.4%, a difference of 0.73%), Russian (6.3%, a difference of 1.2%), Immigrants from Spain (6.3%, a difference of 1.3%), and Immigrants from Ireland (6.3%, a difference of 1.7%). Similarly, the demographic groups most similar to Immigrants from South Africa are Immigrants from Norway (6.0%, a difference of 0.25%), Immigrants from Austria (6.0%, a difference of 0.45%), Cambodian (6.0%, a difference of 0.47%), Immigrants from Russia (6.0%, a difference of 0.77%), and Immigrants from Korea (6.1%, a difference of 1.7%).
| Demographics | Rating | Rank | Professional Degree |
| Immigrants | Denmark | 100.0 /100 | #20 | Exceptional 6.4% |
| Immigrants | Hong Kong | 100.0 /100 | #21 | Exceptional 6.4% |
| Immigrants | Japan | 100.0 /100 | #22 | Exceptional 6.4% |
| Russians | 100.0 /100 | #23 | Exceptional 6.3% |
| Immigrants | Spain | 100.0 /100 | #24 | Exceptional 6.3% |
| Immigrants | Ireland | 100.0 /100 | #25 | Exceptional 6.3% |
| Latvians | 100.0 /100 | #26 | Exceptional 6.2% |
| Immigrants | Northern Europe | 100.0 /100 | #27 | Exceptional 6.2% |
| Turks | 100.0 /100 | #28 | Exceptional 6.2% |
| Immigrants | Sri Lanka | 100.0 /100 | #29 | Exceptional 6.2% |
| Immigrants | Turkey | 100.0 /100 | #30 | Exceptional 6.2% |
| Immigrants | India | 100.0 /100 | #31 | Exceptional 6.2% |
| Thais | 100.0 /100 | #32 | Exceptional 6.1% |
| Burmese | 100.0 /100 | #33 | Exceptional 6.1% |
| Mongolians | 100.0 /100 | #34 | Exceptional 6.1% |
| Immigrants | Korea | 100.0 /100 | #35 | Exceptional 6.1% |
| Immigrants | Russia | 100.0 /100 | #36 | Exceptional 6.0% |
| Immigrants | Austria | 100.0 /100 | #37 | Exceptional 6.0% |
| Immigrants | Norway | 100.0 /100 | #38 | Exceptional 6.0% |
| Immigrants | South Africa | 100.0 /100 | #39 | Exceptional 6.0% |
| Cambodians | 100.0 /100 | #40 | Exceptional 6.0% |