Alaskan Athabascan vs Aleut 12th Grade, No Diploma
COMPARE
Alaskan Athabascan
Aleut
12th Grade, No Diploma
12th Grade, No Diploma Comparison
Alaskan Athabascans
Aleuts
92.3%
12TH GRADE, NO DIPLOMA
98.1/ 100
METRIC RATING
102nd/ 347
METRIC RANK
92.1%
12TH GRADE, NO DIPLOMA
96.3/ 100
METRIC RATING
116th/ 347
METRIC RANK
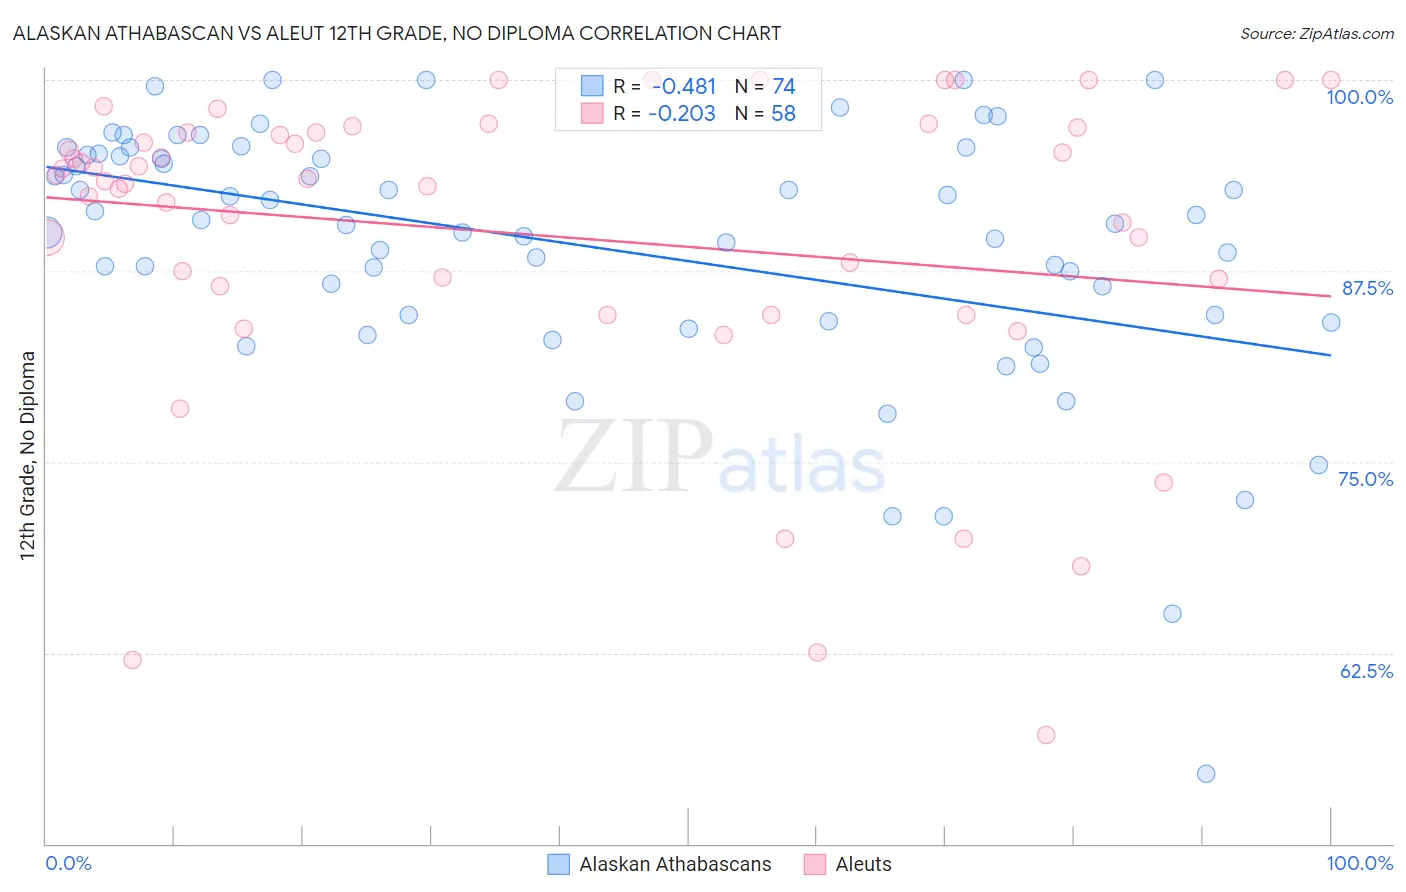
Alaskan Athabascan vs Aleut 12th Grade, No Diploma Correlation Chart
The statistical analysis conducted on geographies consisting of 45,820,221 people shows a moderate negative correlation between the proportion of Alaskan Athabascans and percentage of population with at least 12th grade (no diploma) education in the United States with a correlation coefficient (R) of -0.481 and weighted average of 92.3%. Similarly, the statistical analysis conducted on geographies consisting of 61,782,851 people shows a weak negative correlation between the proportion of Aleuts and percentage of population with at least 12th grade (no diploma) education in the United States with a correlation coefficient (R) of -0.203 and weighted average of 92.1%, a difference of 0.21%.
12th Grade, No Diploma Correlation Summary
| Measurement | Alaskan Athabascan | Aleut |
| Minimum | 54.5% | 57.1% |
| Maximum | 100.0% | 100.0% |
| Range | 45.5% | 42.9% |
| Mean | 89.1% | 89.9% |
| Median | 90.7% | 93.4% |
| Interquartile 25% (IQ1) | 84.6% | 86.5% |
| Interquartile 75% (IQ3) | 95.1% | 96.6% |
| Interquartile Range (IQR) | 10.5% | 10.1% |
| Standard Deviation (Sample) | 8.5% | 10.4% |
| Standard Deviation (Population) | 8.5% | 10.3% |
Demographics Similar to Alaskan Athabascans and Aleuts by 12th Grade, No Diploma
In terms of 12th grade, no diploma, the demographic groups most similar to Alaskan Athabascans are Swiss (92.3%, a difference of 0.0%), Immigrants from Norway (92.3%, a difference of 0.0%), Immigrants from Croatia (92.3%, a difference of 0.030%), Immigrants from Korea (92.3%, a difference of 0.040%), and Lebanese (92.2%, a difference of 0.080%). Similarly, the demographic groups most similar to Aleuts are Immigrants from Eastern Europe (92.1%, a difference of 0.0%), Immigrants from Zimbabwe (92.1%, a difference of 0.010%), Yugoslavian (92.1%, a difference of 0.010%), Immigrants from Sri Lanka (92.1%, a difference of 0.010%), and Israeli (92.1%, a difference of 0.040%).
| Demographics | Rating | Rank | 12th Grade, No Diploma |
| Immigrants | Korea | 98.3 /100 | #99 | Exceptional 92.3% |
| Immigrants | Croatia | 98.3 /100 | #100 | Exceptional 92.3% |
| Swiss | 98.1 /100 | #101 | Exceptional 92.3% |
| Alaskan Athabascans | 98.1 /100 | #102 | Exceptional 92.3% |
| Immigrants | Norway | 98.1 /100 | #103 | Exceptional 92.3% |
| Lebanese | 97.6 /100 | #104 | Exceptional 92.2% |
| Immigrants | Belarus | 97.4 /100 | #105 | Exceptional 92.2% |
| Immigrants | Russia | 97.3 /100 | #106 | Exceptional 92.2% |
| Syrians | 97.2 /100 | #107 | Exceptional 92.2% |
| Jordanians | 97.2 /100 | #108 | Exceptional 92.2% |
| Immigrants | Hungary | 97.0 /100 | #109 | Exceptional 92.1% |
| Palestinians | 97.0 /100 | #110 | Exceptional 92.1% |
| Immigrants | Greece | 96.9 /100 | #111 | Exceptional 92.1% |
| Israelis | 96.8 /100 | #112 | Exceptional 92.1% |
| Immigrants | Zimbabwe | 96.5 /100 | #113 | Exceptional 92.1% |
| Yugoslavians | 96.5 /100 | #114 | Exceptional 92.1% |
| Immigrants | Sri Lanka | 96.4 /100 | #115 | Exceptional 92.1% |
| Aleuts | 96.3 /100 | #116 | Exceptional 92.1% |
| Immigrants | Eastern Europe | 96.3 /100 | #117 | Exceptional 92.1% |
| Puget Sound Salish | 95.8 /100 | #118 | Exceptional 92.0% |
| Immigrants | Germany | 95.5 /100 | #119 | Exceptional 92.0% |