African vs South African 2nd Grade
COMPARE
African
South African
2nd Grade
2nd Grade Comparison
Africans
South Africans
97.7%
2ND GRADE
15.6/ 100
METRIC RATING
207th/ 347
METRIC RANK
98.2%
2ND GRADE
98.6/ 100
METRIC RATING
95th/ 347
METRIC RANK
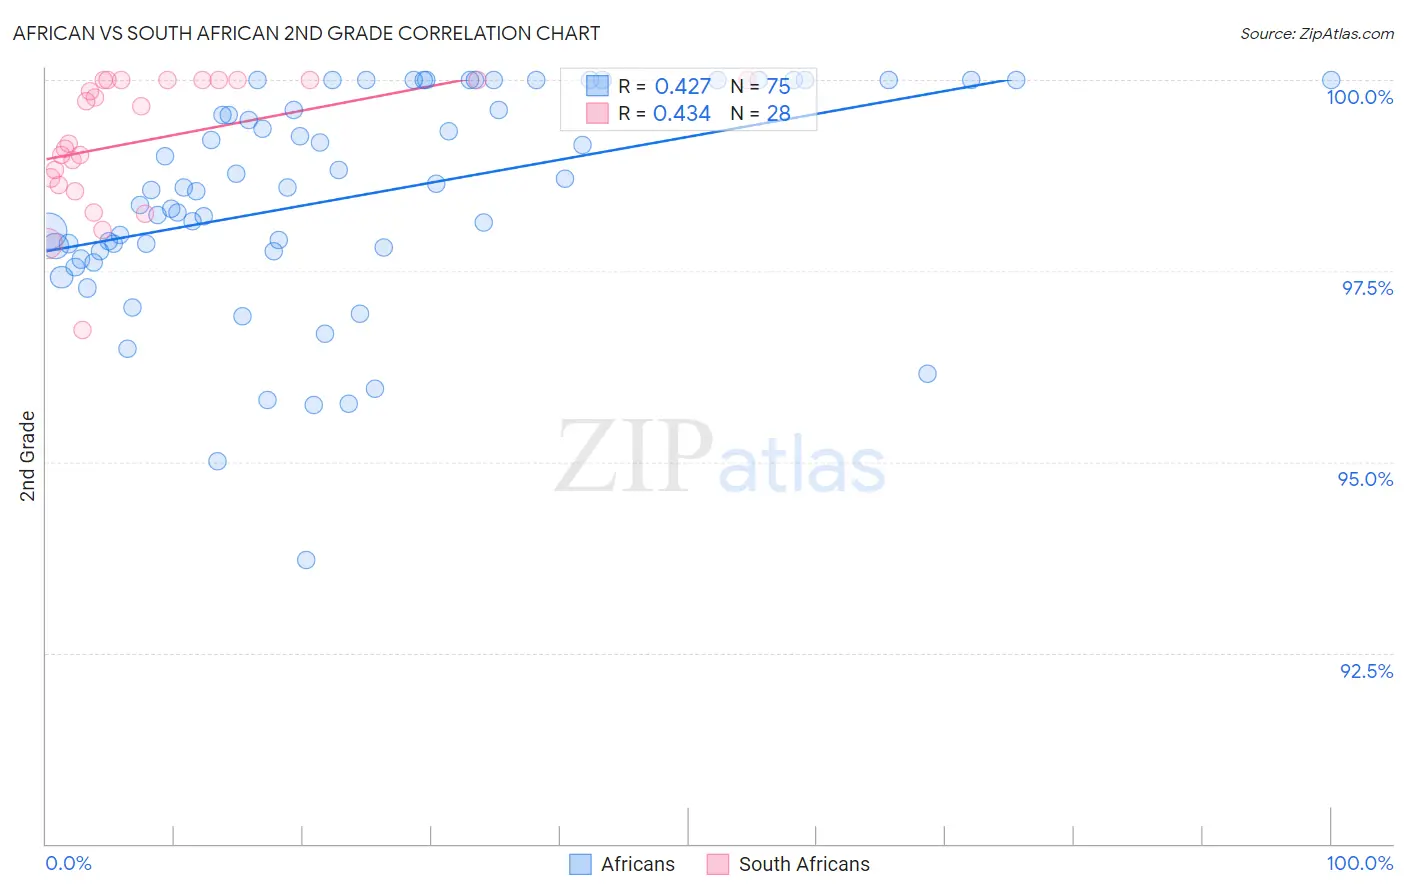
African vs South African 2nd Grade Correlation Chart
The statistical analysis conducted on geographies consisting of 470,094,148 people shows a moderate positive correlation between the proportion of Africans and percentage of population with at least 2nd grade education in the United States with a correlation coefficient (R) of 0.427 and weighted average of 97.7%. Similarly, the statistical analysis conducted on geographies consisting of 182,602,894 people shows a moderate positive correlation between the proportion of South Africans and percentage of population with at least 2nd grade education in the United States with a correlation coefficient (R) of 0.434 and weighted average of 98.2%, a difference of 0.47%.
2nd Grade Correlation Summary
| Measurement | African | South African |
| Minimum | 93.7% | 96.7% |
| Maximum | 100.0% | 100.0% |
| Range | 6.3% | 3.3% |
| Mean | 98.5% | 99.2% |
| Median | 98.6% | 99.4% |
| Interquartile 25% (IQ1) | 97.8% | 98.7% |
| Interquartile 75% (IQ3) | 100.0% | 100.0% |
| Interquartile Range (IQR) | 2.2% | 1.3% |
| Standard Deviation (Sample) | 1.4% | 0.86% |
| Standard Deviation (Population) | 1.4% | 0.84% |
Similar Demographics by 2nd Grade
Demographics Similar to Africans by 2nd Grade
In terms of 2nd grade, the demographic groups most similar to Africans are Immigrants from Southern Europe (97.8%, a difference of 0.010%), Immigrants from Chile (97.7%, a difference of 0.010%), Yuman (97.8%, a difference of 0.020%), Immigrants from Albania (97.8%, a difference of 0.020%), and Immigrants from Northern Africa (97.7%, a difference of 0.020%).
| Demographics | Rating | Rank | 2nd Grade |
| Immigrants | Lebanon | 20.9 /100 | #200 | Fair 97.8% |
| Tohono O'odham | 20.9 /100 | #201 | Fair 97.8% |
| Immigrants | Ukraine | 20.5 /100 | #202 | Fair 97.8% |
| Yuman | 20.0 /100 | #203 | Fair 97.8% |
| Immigrants | Albania | 18.4 /100 | #204 | Poor 97.8% |
| Immigrants | Southern Europe | 18.1 /100 | #205 | Poor 97.8% |
| Immigrants | Chile | 17.3 /100 | #206 | Poor 97.7% |
| Africans | 15.6 /100 | #207 | Poor 97.7% |
| Immigrants | Northern Africa | 12.3 /100 | #208 | Poor 97.7% |
| Immigrants | Oceania | 10.9 /100 | #209 | Poor 97.7% |
| Costa Ricans | 10.5 /100 | #210 | Poor 97.7% |
| Laotians | 9.9 /100 | #211 | Tragic 97.7% |
| Immigrants | Bahamas | 8.4 /100 | #212 | Tragic 97.7% |
| Moroccans | 8.2 /100 | #213 | Tragic 97.7% |
| Samoans | 7.1 /100 | #214 | Tragic 97.7% |
Demographics Similar to South Africans by 2nd Grade
In terms of 2nd grade, the demographic groups most similar to South Africans are Immigrants from Germany (98.2%, a difference of 0.0%), Immigrants from India (98.2%, a difference of 0.010%), Cypriot (98.2%, a difference of 0.010%), Ukrainian (98.2%, a difference of 0.020%), and Zimbabwean (98.2%, a difference of 0.020%).
| Demographics | Rating | Rank | 2nd Grade |
| Macedonians | 99.0 /100 | #88 | Exceptional 98.2% |
| Ukrainians | 98.9 /100 | #89 | Exceptional 98.2% |
| Zimbabweans | 98.8 /100 | #90 | Exceptional 98.2% |
| Immigrants | Western Europe | 98.8 /100 | #91 | Exceptional 98.2% |
| Immigrants | South Africa | 98.8 /100 | #92 | Exceptional 98.2% |
| Immigrants | India | 98.8 /100 | #93 | Exceptional 98.2% |
| Immigrants | Germany | 98.6 /100 | #94 | Exceptional 98.2% |
| South Africans | 98.6 /100 | #95 | Exceptional 98.2% |
| Cypriots | 98.4 /100 | #96 | Exceptional 98.2% |
| Choctaw | 98.3 /100 | #97 | Exceptional 98.2% |
| Immigrants | Nonimmigrants | 98.3 /100 | #98 | Exceptional 98.2% |
| Immigrants | Ireland | 98.0 /100 | #99 | Exceptional 98.2% |
| Romanians | 98.0 /100 | #100 | Exceptional 98.2% |
| Puget Sound Salish | 98.0 /100 | #101 | Exceptional 98.2% |
| Cree | 98.0 /100 | #102 | Exceptional 98.2% |