Ottawa vs Bangladeshi Cognitive Disability
COMPARE
Ottawa
Bangladeshi
Cognitive Disability
Cognitive Disability Comparison
Ottawa
Bangladeshis
18.2%
COGNITIVE DISABILITY
0.1/ 100
METRIC RATING
291st/ 347
METRIC RANK
18.6%
COGNITIVE DISABILITY
0.0/ 100
METRIC RATING
318th/ 347
METRIC RANK
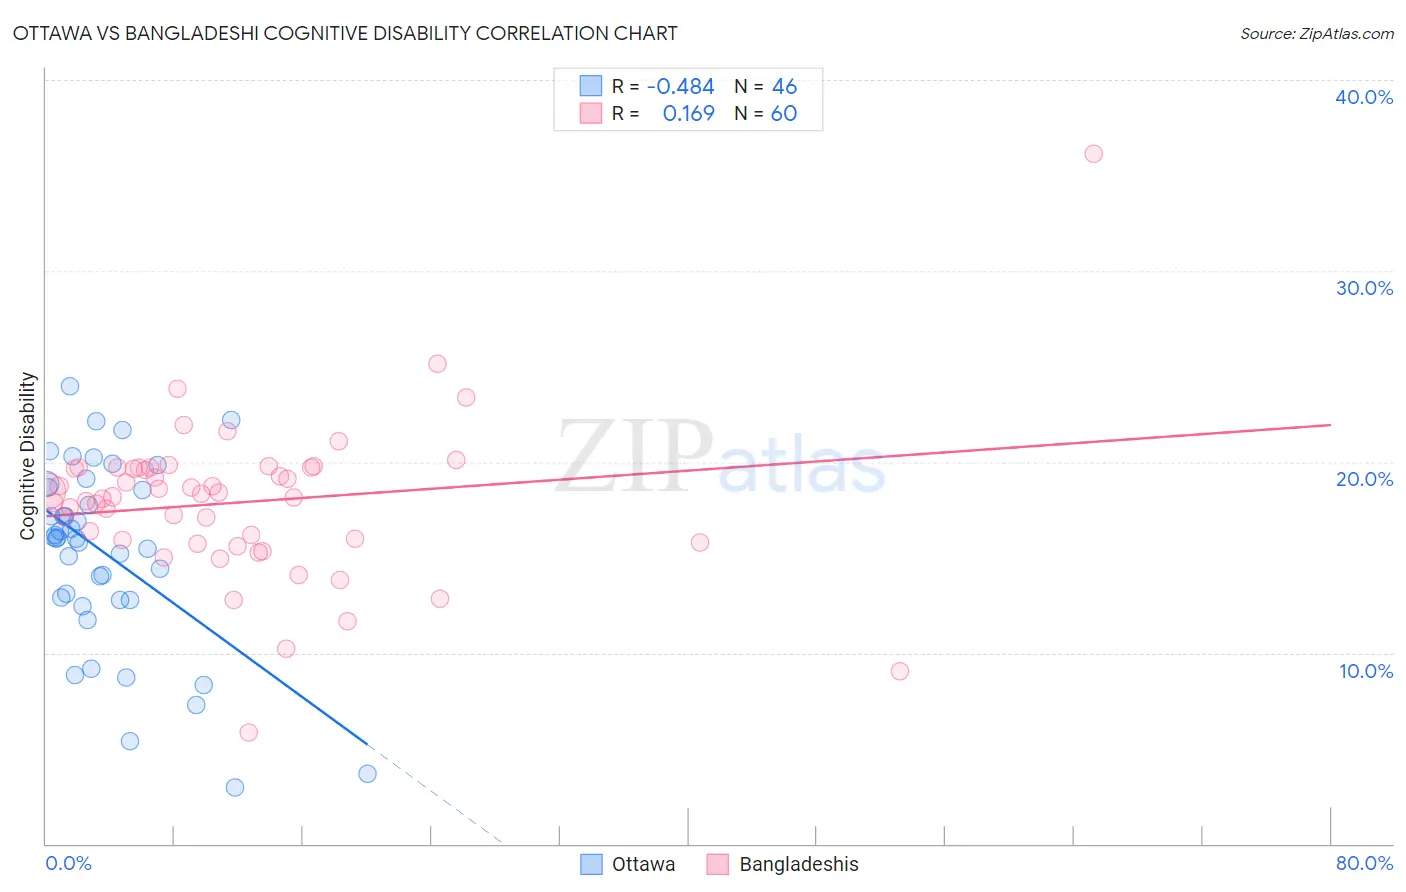
Ottawa vs Bangladeshi Cognitive Disability Correlation Chart
The statistical analysis conducted on geographies consisting of 49,955,191 people shows a moderate negative correlation between the proportion of Ottawa and percentage of population with cognitive disability in the United States with a correlation coefficient (R) of -0.484 and weighted average of 18.2%. Similarly, the statistical analysis conducted on geographies consisting of 141,390,027 people shows a poor positive correlation between the proportion of Bangladeshis and percentage of population with cognitive disability in the United States with a correlation coefficient (R) of 0.169 and weighted average of 18.6%, a difference of 2.4%.
Cognitive Disability Correlation Summary
| Measurement | Ottawa | Bangladeshi |
| Minimum | 2.9% | 5.8% |
| Maximum | 24.0% | 36.1% |
| Range | 21.0% | 30.3% |
| Mean | 15.2% | 17.9% |
| Median | 16.0% | 18.3% |
| Interquartile 25% (IQ1) | 12.8% | 15.9% |
| Interquartile 75% (IQ3) | 18.7% | 19.7% |
| Interquartile Range (IQR) | 5.9% | 3.8% |
| Standard Deviation (Sample) | 4.9% | 4.1% |
| Standard Deviation (Population) | 4.8% | 4.1% |
Similar Demographics by Cognitive Disability
Demographics Similar to Ottawa by Cognitive Disability
In terms of cognitive disability, the demographic groups most similar to Ottawa are Iroquois (18.2%, a difference of 0.070%), Central American Indian (18.2%, a difference of 0.080%), Immigrants from Africa (18.1%, a difference of 0.13%), British West Indian (18.2%, a difference of 0.15%), and Native/Alaskan (18.1%, a difference of 0.16%).
| Demographics | Rating | Rank | Cognitive Disability |
| Immigrants | Uganda | 0.1 /100 | #284 | Tragic 18.1% |
| Bermudans | 0.1 /100 | #285 | Tragic 18.1% |
| Kenyans | 0.1 /100 | #286 | Tragic 18.1% |
| Dutch West Indians | 0.1 /100 | #287 | Tragic 18.1% |
| Immigrants | West Indies | 0.1 /100 | #288 | Tragic 18.1% |
| Natives/Alaskans | 0.1 /100 | #289 | Tragic 18.1% |
| Immigrants | Africa | 0.1 /100 | #290 | Tragic 18.1% |
| Ottawa | 0.1 /100 | #291 | Tragic 18.2% |
| Iroquois | 0.1 /100 | #292 | Tragic 18.2% |
| Central American Indians | 0.1 /100 | #293 | Tragic 18.2% |
| British West Indians | 0.1 /100 | #294 | Tragic 18.2% |
| German Russians | 0.0 /100 | #295 | Tragic 18.2% |
| Immigrants | Burma/Myanmar | 0.0 /100 | #296 | Tragic 18.2% |
| Blackfeet | 0.0 /100 | #297 | Tragic 18.3% |
| Japanese | 0.0 /100 | #298 | Tragic 18.3% |
Demographics Similar to Bangladeshis by Cognitive Disability
In terms of cognitive disability, the demographic groups most similar to Bangladeshis are Comanche (18.6%, a difference of 0.040%), Apache (18.6%, a difference of 0.080%), Liberian (18.6%, a difference of 0.12%), African (18.6%, a difference of 0.17%), and Immigrants from Middle Africa (18.6%, a difference of 0.20%).
| Demographics | Rating | Rank | Cognitive Disability |
| Hmong | 0.0 /100 | #311 | Tragic 18.4% |
| Chickasaw | 0.0 /100 | #312 | Tragic 18.5% |
| Yaqui | 0.0 /100 | #313 | Tragic 18.5% |
| Sub-Saharan Africans | 0.0 /100 | #314 | Tragic 18.5% |
| Immigrants | Dominica | 0.0 /100 | #315 | Tragic 18.6% |
| Immigrants | Middle Africa | 0.0 /100 | #316 | Tragic 18.6% |
| Liberians | 0.0 /100 | #317 | Tragic 18.6% |
| Bangladeshis | 0.0 /100 | #318 | Tragic 18.6% |
| Comanche | 0.0 /100 | #319 | Tragic 18.6% |
| Apache | 0.0 /100 | #320 | Tragic 18.6% |
| Africans | 0.0 /100 | #321 | Tragic 18.6% |
| Immigrants | Liberia | 0.0 /100 | #322 | Tragic 18.7% |
| Pueblo | 0.0 /100 | #323 | Tragic 18.7% |
| Dominicans | 0.0 /100 | #324 | Tragic 18.7% |
| Indonesians | 0.0 /100 | #325 | Tragic 18.7% |