U.S. Virgin Islander vs Immigrants from Belize Disability Age Over 75
COMPARE
U.S. Virgin Islander
Immigrants from Belize
Disability Age Over 75
Disability Age Over 75 Comparison
U.S. Virgin Islanders
Immigrants from Belize
48.9%
DISABILITY AGE OVER 75
0.2/ 100
METRIC RATING
266th/ 347
METRIC RANK
49.6%
DISABILITY AGE OVER 75
0.0/ 100
METRIC RATING
286th/ 347
METRIC RANK
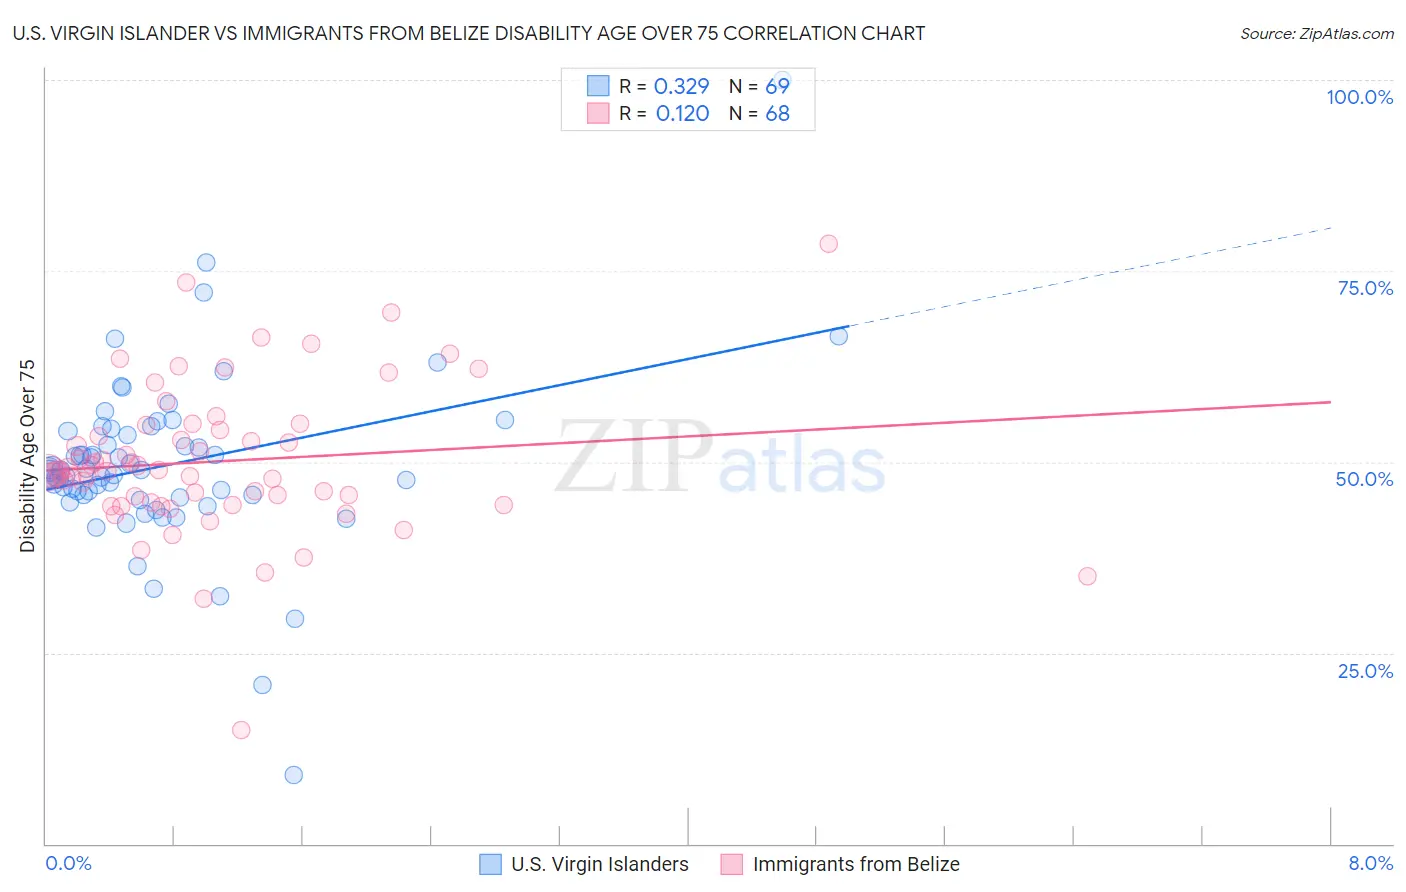
U.S. Virgin Islander vs Immigrants from Belize Disability Age Over 75 Correlation Chart
The statistical analysis conducted on geographies consisting of 87,458,897 people shows a mild positive correlation between the proportion of U.S. Virgin Islanders and percentage of population with a disability over the age of 75 in the United States with a correlation coefficient (R) of 0.329 and weighted average of 48.9%. Similarly, the statistical analysis conducted on geographies consisting of 130,240,779 people shows a poor positive correlation between the proportion of Immigrants from Belize and percentage of population with a disability over the age of 75 in the United States with a correlation coefficient (R) of 0.120 and weighted average of 49.6%, a difference of 1.4%.
Disability Age Over 75 Correlation Summary
| Measurement | U.S. Virgin Islander | Immigrants from Belize |
| Minimum | 9.0% | 14.9% |
| Maximum | 100.0% | 78.6% |
| Range | 91.0% | 63.7% |
| Mean | 49.6% | 50.1% |
| Median | 48.8% | 48.8% |
| Interquartile 25% (IQ1) | 45.5% | 44.5% |
| Interquartile 75% (IQ3) | 54.2% | 54.5% |
| Interquartile Range (IQR) | 8.7% | 10.0% |
| Standard Deviation (Sample) | 11.7% | 9.9% |
| Standard Deviation (Population) | 11.7% | 9.8% |
Demographics Similar to U.S. Virgin Islanders and Immigrants from Belize by Disability Age Over 75
In terms of disability age over 75, the demographic groups most similar to U.S. Virgin Islanders are Malaysian (49.0%, a difference of 0.13%), Guatemalan (49.0%, a difference of 0.15%), Immigrants from El Salvador (49.0%, a difference of 0.17%), Potawatomi (49.0%, a difference of 0.20%), and Fijian (49.0%, a difference of 0.22%). Similarly, the demographic groups most similar to Immigrants from Belize are Crow (49.6%, a difference of 0.080%), Immigrants from Latin America (49.5%, a difference of 0.22%), Samoan (49.5%, a difference of 0.27%), Black/African American (49.5%, a difference of 0.30%), and Bangladeshi (49.4%, a difference of 0.44%).
| Demographics | Rating | Rank | Disability Age Over 75 |
| U.S. Virgin Islanders | 0.2 /100 | #266 | Tragic 48.9% |
| Malaysians | 0.2 /100 | #267 | Tragic 49.0% |
| Guatemalans | 0.2 /100 | #268 | Tragic 49.0% |
| Immigrants | El Salvador | 0.2 /100 | #269 | Tragic 49.0% |
| Potawatomi | 0.2 /100 | #270 | Tragic 49.0% |
| Fijians | 0.2 /100 | #271 | Tragic 49.0% |
| Assyrians/Chaldeans/Syriacs | 0.2 /100 | #272 | Tragic 49.1% |
| Immigrants | Iraq | 0.1 /100 | #273 | Tragic 49.1% |
| Immigrants | Guatemala | 0.1 /100 | #274 | Tragic 49.1% |
| Immigrants | Dominica | 0.1 /100 | #275 | Tragic 49.1% |
| Immigrants | Uzbekistan | 0.1 /100 | #276 | Tragic 49.2% |
| Hawaiians | 0.1 /100 | #277 | Tragic 49.2% |
| Immigrants | Laos | 0.1 /100 | #278 | Tragic 49.2% |
| Guamanians/Chamorros | 0.0 /100 | #279 | Tragic 49.4% |
| Bangladeshis | 0.0 /100 | #280 | Tragic 49.4% |
| Belizeans | 0.0 /100 | #281 | Tragic 49.4% |
| Blacks/African Americans | 0.0 /100 | #282 | Tragic 49.5% |
| Samoans | 0.0 /100 | #283 | Tragic 49.5% |
| Immigrants | Latin America | 0.0 /100 | #284 | Tragic 49.5% |
| Crow | 0.0 /100 | #285 | Tragic 49.6% |
| Immigrants | Belize | 0.0 /100 | #286 | Tragic 49.6% |