Immigrants vs Immigrants from Nigeria Disability Age 65 to 74
COMPARE
Immigrants
Immigrants from Nigeria
Disability Age 65 to 74
Disability Age 65 to 74 Comparison
Immigrants
Immigrants from Nigeria
23.7%
DISABILITY AGE 65 TO 74
25.8/ 100
METRIC RATING
197th/ 347
METRIC RANK
24.0%
DISABILITY AGE 65 TO 74
11.7/ 100
METRIC RATING
218th/ 347
METRIC RANK
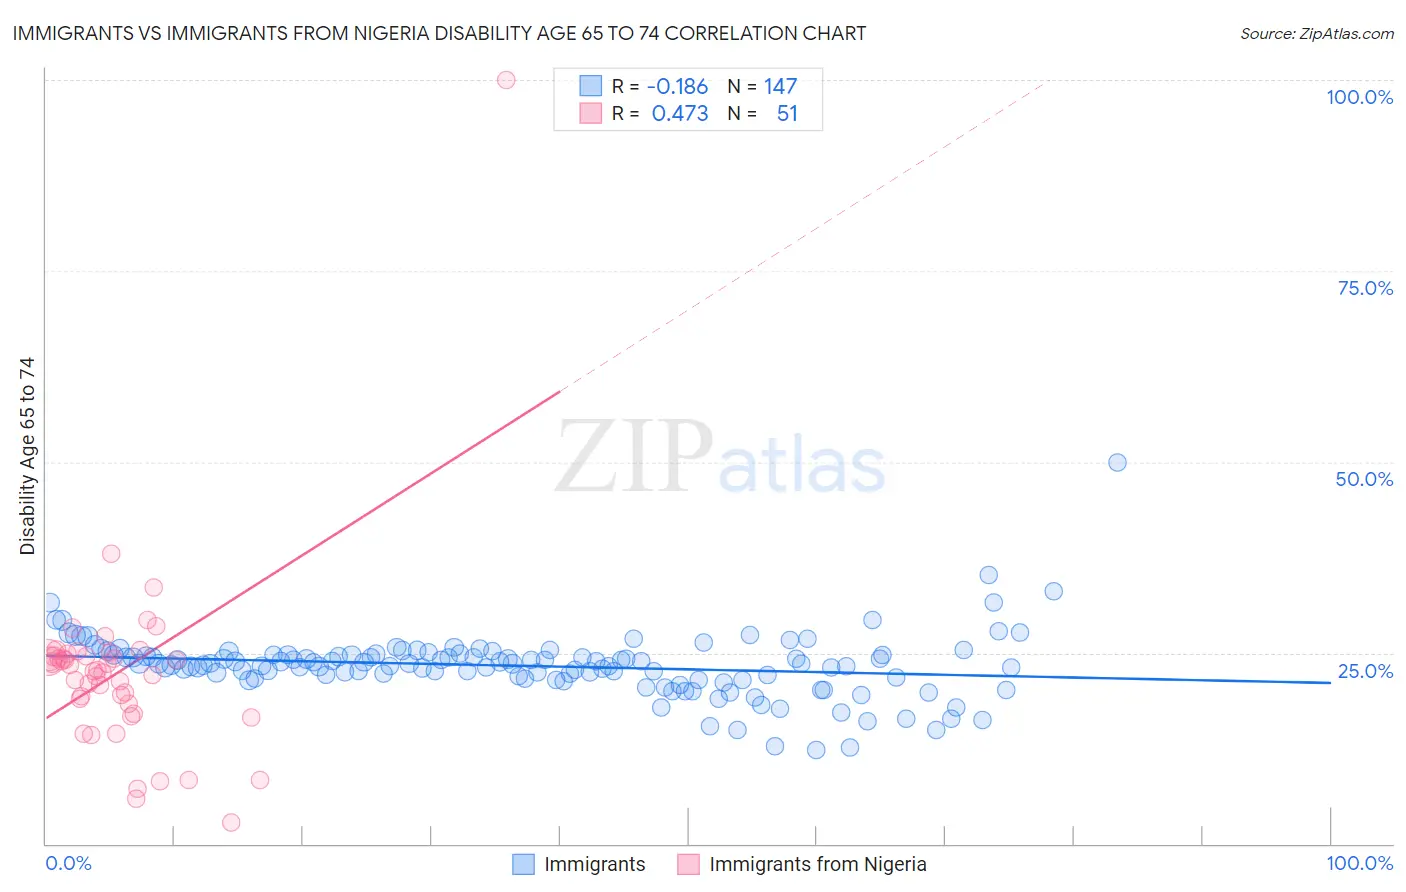
Immigrants vs Immigrants from Nigeria Disability Age 65 to 74 Correlation Chart
The statistical analysis conducted on geographies consisting of 574,995,513 people shows a poor negative correlation between the proportion of Immigrants and percentage of population with a disability between the ages 65 and 75 in the United States with a correlation coefficient (R) of -0.186 and weighted average of 23.7%. Similarly, the statistical analysis conducted on geographies consisting of 283,043,731 people shows a moderate positive correlation between the proportion of Immigrants from Nigeria and percentage of population with a disability between the ages 65 and 75 in the United States with a correlation coefficient (R) of 0.473 and weighted average of 24.0%, a difference of 1.4%.
Disability Age 65 to 74 Correlation Summary
| Measurement | Immigrants | Immigrants from Nigeria |
| Minimum | 12.3% | 2.8% |
| Maximum | 50.0% | 100.0% |
| Range | 37.7% | 97.2% |
| Mean | 23.3% | 22.5% |
| Median | 23.5% | 22.7% |
| Interquartile 25% (IQ1) | 21.7% | 18.3% |
| Interquartile 75% (IQ3) | 24.8% | 24.5% |
| Interquartile Range (IQR) | 3.1% | 6.2% |
| Standard Deviation (Sample) | 4.2% | 13.0% |
| Standard Deviation (Population) | 4.2% | 12.9% |
Similar Demographics by Disability Age 65 to 74
Demographics Similar to Immigrants by Disability Age 65 to 74
In terms of disability age 65 to 74, the demographic groups most similar to Immigrants are Immigrants from St. Vincent and the Grenadines (23.7%, a difference of 0.020%), Immigrants from Trinidad and Tobago (23.7%, a difference of 0.020%), Immigrants from Africa (23.7%, a difference of 0.11%), Welsh (23.7%, a difference of 0.11%), and French Canadian (23.7%, a difference of 0.14%).
| Demographics | Rating | Rank | Disability Age 65 to 74 |
| Immigrants | Guyana | 31.2 /100 | #190 | Fair 23.6% |
| Immigrants | Bangladesh | 30.2 /100 | #191 | Fair 23.6% |
| Ecuadorians | 29.7 /100 | #192 | Fair 23.6% |
| English | 28.5 /100 | #193 | Fair 23.6% |
| Sudanese | 27.8 /100 | #194 | Fair 23.7% |
| Immigrants | St. Vincent and the Grenadines | 26.1 /100 | #195 | Fair 23.7% |
| Immigrants | Trinidad and Tobago | 26.1 /100 | #196 | Fair 23.7% |
| Immigrants | Immigrants | 25.8 /100 | #197 | Fair 23.7% |
| Immigrants | Africa | 24.4 /100 | #198 | Fair 23.7% |
| Welsh | 24.3 /100 | #199 | Fair 23.7% |
| French Canadians | 24.0 /100 | #200 | Fair 23.7% |
| Immigrants | Ecuador | 23.9 /100 | #201 | Fair 23.7% |
| Immigrants | Bahamas | 23.3 /100 | #202 | Fair 23.7% |
| Kenyans | 23.2 /100 | #203 | Fair 23.7% |
| Immigrants | Grenada | 22.1 /100 | #204 | Fair 23.8% |
Demographics Similar to Immigrants from Nigeria by Disability Age 65 to 74
In terms of disability age 65 to 74, the demographic groups most similar to Immigrants from Nigeria are Immigrants from Portugal (24.0%, a difference of 0.0%), Immigrants from Burma/Myanmar (24.0%, a difference of 0.020%), Jamaican (24.0%, a difference of 0.070%), Ghanaian (24.1%, a difference of 0.19%), and Pennsylvania German (24.0%, a difference of 0.20%).
| Demographics | Rating | Rank | Disability Age 65 to 74 |
| Immigrants | West Indies | 15.9 /100 | #211 | Poor 23.9% |
| French | 15.7 /100 | #212 | Poor 23.9% |
| Nicaraguans | 14.3 /100 | #213 | Poor 23.9% |
| Immigrants | Oceania | 13.6 /100 | #214 | Poor 24.0% |
| Pennsylvania Germans | 13.3 /100 | #215 | Poor 24.0% |
| Jamaicans | 12.2 /100 | #216 | Poor 24.0% |
| Immigrants | Portugal | 11.7 /100 | #217 | Poor 24.0% |
| Immigrants | Nigeria | 11.7 /100 | #218 | Poor 24.0% |
| Immigrants | Burma/Myanmar | 11.6 /100 | #219 | Poor 24.0% |
| Ghanaians | 10.4 /100 | #220 | Poor 24.1% |
| Immigrants | Nicaragua | 9.8 /100 | #221 | Tragic 24.1% |
| Native Hawaiians | 9.3 /100 | #222 | Tragic 24.1% |
| Immigrants | Middle Africa | 8.9 /100 | #223 | Tragic 24.1% |
| Immigrants | Panama | 8.6 /100 | #224 | Tragic 24.1% |
| Bermudans | 8.2 /100 | #225 | Tragic 24.2% |