Syrian vs Immigrants from Colombia Disability Age 65 to 74
COMPARE
Syrian
Immigrants from Colombia
Disability Age 65 to 74
Disability Age 65 to 74 Comparison
Syrians
Immigrants from Colombia
22.3%
DISABILITY AGE 65 TO 74
95.3/ 100
METRIC RATING
113th/ 347
METRIC RANK
22.2%
DISABILITY AGE 65 TO 74
96.8/ 100
METRIC RATING
99th/ 347
METRIC RANK
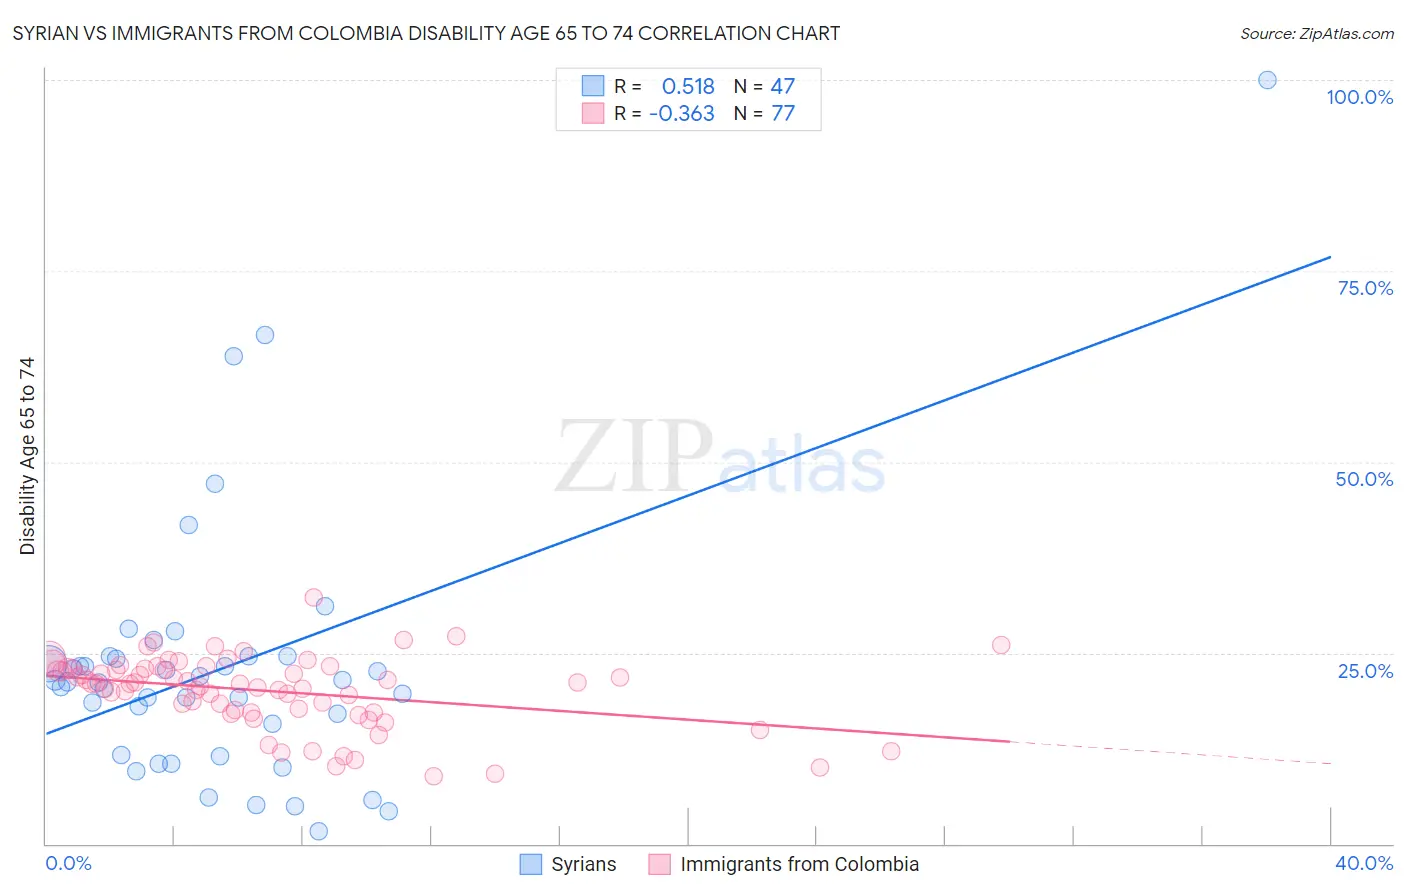
Syrian vs Immigrants from Colombia Disability Age 65 to 74 Correlation Chart
The statistical analysis conducted on geographies consisting of 266,020,222 people shows a substantial positive correlation between the proportion of Syrians and percentage of population with a disability between the ages 65 and 75 in the United States with a correlation coefficient (R) of 0.518 and weighted average of 22.3%. Similarly, the statistical analysis conducted on geographies consisting of 378,083,554 people shows a mild negative correlation between the proportion of Immigrants from Colombia and percentage of population with a disability between the ages 65 and 75 in the United States with a correlation coefficient (R) of -0.363 and weighted average of 22.2%, a difference of 0.59%.
Disability Age 65 to 74 Correlation Summary
| Measurement | Syrian | Immigrants from Colombia |
| Minimum | 1.7% | 8.8% |
| Maximum | 100.0% | 32.2% |
| Range | 98.3% | 23.4% |
| Mean | 22.9% | 20.0% |
| Median | 21.2% | 21.0% |
| Interquartile 25% (IQ1) | 11.7% | 17.3% |
| Interquartile 75% (IQ3) | 24.5% | 23.0% |
| Interquartile Range (IQR) | 12.8% | 5.6% |
| Standard Deviation (Sample) | 17.3% | 4.7% |
| Standard Deviation (Population) | 17.1% | 4.6% |
Demographics Similar to Syrians and Immigrants from Colombia by Disability Age 65 to 74
In terms of disability age 65 to 74, the demographic groups most similar to Syrians are Immigrants from South America (22.3%, a difference of 0.050%), Ukrainian (22.3%, a difference of 0.080%), Serbian (22.3%, a difference of 0.11%), Immigrants from Peru (22.3%, a difference of 0.13%), and Laotian (22.3%, a difference of 0.15%). Similarly, the demographic groups most similar to Immigrants from Colombia are Jordanian (22.2%, a difference of 0.030%), Uruguayan (22.2%, a difference of 0.13%), Immigrants from England (22.2%, a difference of 0.14%), Immigrants from Saudi Arabia (22.2%, a difference of 0.17%), and South American (22.2%, a difference of 0.19%).
| Demographics | Rating | Rank | Disability Age 65 to 74 |
| Immigrants | North America | 97.5 /100 | #96 | Exceptional 22.1% |
| Immigrants | Southern Europe | 97.2 /100 | #97 | Exceptional 22.1% |
| Jordanians | 96.9 /100 | #98 | Exceptional 22.2% |
| Immigrants | Colombia | 96.8 /100 | #99 | Exceptional 22.2% |
| Uruguayans | 96.5 /100 | #100 | Exceptional 22.2% |
| Immigrants | England | 96.5 /100 | #101 | Exceptional 22.2% |
| Immigrants | Saudi Arabia | 96.4 /100 | #102 | Exceptional 22.2% |
| South Americans | 96.4 /100 | #103 | Exceptional 22.2% |
| Colombians | 96.4 /100 | #104 | Exceptional 22.2% |
| Palestinians | 96.3 /100 | #105 | Exceptional 22.2% |
| Peruvians | 96.1 /100 | #106 | Exceptional 22.2% |
| Slovenes | 96.1 /100 | #107 | Exceptional 22.2% |
| Immigrants | Zimbabwe | 96.1 /100 | #108 | Exceptional 22.3% |
| Albanians | 95.8 /100 | #109 | Exceptional 22.3% |
| Immigrants | Peru | 95.7 /100 | #110 | Exceptional 22.3% |
| Serbians | 95.7 /100 | #111 | Exceptional 22.3% |
| Immigrants | South America | 95.5 /100 | #112 | Exceptional 22.3% |
| Syrians | 95.3 /100 | #113 | Exceptional 22.3% |
| Ukrainians | 95.1 /100 | #114 | Exceptional 22.3% |
| Laotians | 94.9 /100 | #115 | Exceptional 22.3% |
| Brazilians | 94.8 /100 | #116 | Exceptional 22.4% |