Delaware vs Immigrants from Colombia Disability Age 65 to 74
COMPARE
Delaware
Immigrants from Colombia
Disability Age 65 to 74
Disability Age 65 to 74 Comparison
Delaware
Immigrants from Colombia
25.9%
DISABILITY AGE 65 TO 74
0.1/ 100
METRIC RATING
282nd/ 347
METRIC RANK
22.2%
DISABILITY AGE 65 TO 74
96.8/ 100
METRIC RATING
99th/ 347
METRIC RANK
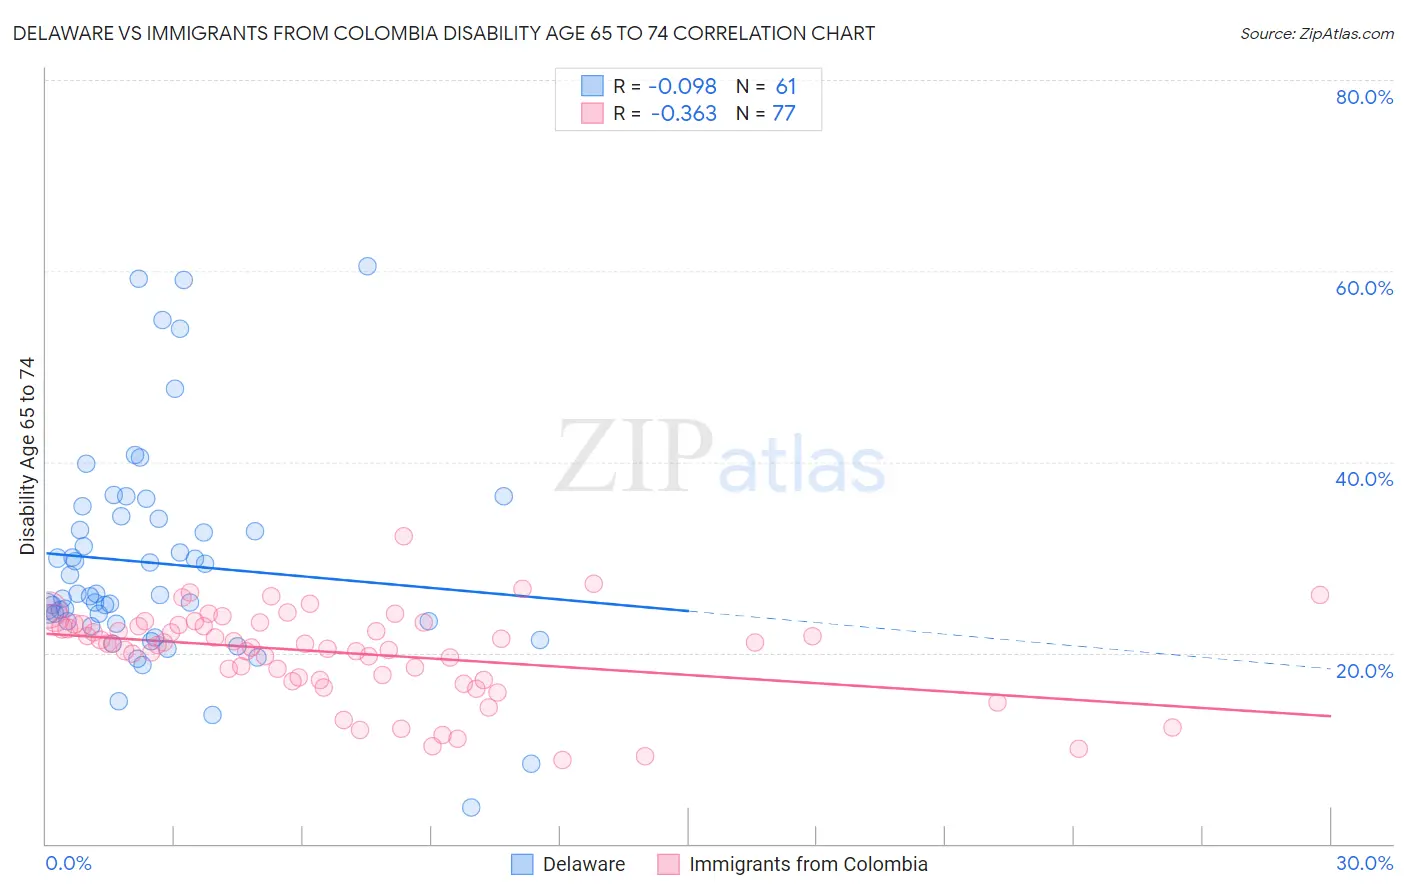
Delaware vs Immigrants from Colombia Disability Age 65 to 74 Correlation Chart
The statistical analysis conducted on geographies consisting of 96,201,129 people shows a slight negative correlation between the proportion of Delaware and percentage of population with a disability between the ages 65 and 75 in the United States with a correlation coefficient (R) of -0.098 and weighted average of 25.9%. Similarly, the statistical analysis conducted on geographies consisting of 378,083,554 people shows a mild negative correlation between the proportion of Immigrants from Colombia and percentage of population with a disability between the ages 65 and 75 in the United States with a correlation coefficient (R) of -0.363 and weighted average of 22.2%, a difference of 16.8%.
Disability Age 65 to 74 Correlation Summary
| Measurement | Delaware | Immigrants from Colombia |
| Minimum | 3.8% | 8.8% |
| Maximum | 60.5% | 32.2% |
| Range | 56.6% | 23.4% |
| Mean | 29.3% | 20.0% |
| Median | 26.1% | 21.0% |
| Interquartile 25% (IQ1) | 23.2% | 17.3% |
| Interquartile 75% (IQ3) | 34.2% | 23.0% |
| Interquartile Range (IQR) | 11.0% | 5.6% |
| Standard Deviation (Sample) | 11.4% | 4.7% |
| Standard Deviation (Population) | 11.3% | 4.6% |
Similar Demographics by Disability Age 65 to 74
Demographics Similar to Delaware by Disability Age 65 to 74
In terms of disability age 65 to 74, the demographic groups most similar to Delaware are Immigrants from Honduras (25.9%, a difference of 0.070%), Cree (25.9%, a difference of 0.090%), Spanish American (25.9%, a difference of 0.14%), U.S. Virgin Islander (25.9%, a difference of 0.18%), and Immigrants from Belize (25.8%, a difference of 0.26%).
| Demographics | Rating | Rank | Disability Age 65 to 74 |
| Hondurans | 0.1 /100 | #275 | Tragic 25.8% |
| French American Indians | 0.1 /100 | #276 | Tragic 25.8% |
| Belizeans | 0.1 /100 | #277 | Tragic 25.8% |
| Immigrants | Belize | 0.1 /100 | #278 | Tragic 25.8% |
| U.S. Virgin Islanders | 0.1 /100 | #279 | Tragic 25.9% |
| Cree | 0.1 /100 | #280 | Tragic 25.9% |
| Immigrants | Honduras | 0.1 /100 | #281 | Tragic 25.9% |
| Delaware | 0.1 /100 | #282 | Tragic 25.9% |
| Spanish Americans | 0.0 /100 | #283 | Tragic 25.9% |
| Immigrants | Azores | 0.0 /100 | #284 | Tragic 26.0% |
| Immigrants | Congo | 0.0 /100 | #285 | Tragic 26.0% |
| Immigrants | Micronesia | 0.0 /100 | #286 | Tragic 26.1% |
| Immigrants | Laos | 0.0 /100 | #287 | Tragic 26.1% |
| Mexican American Indians | 0.0 /100 | #288 | Tragic 26.2% |
| Africans | 0.0 /100 | #289 | Tragic 26.2% |
Demographics Similar to Immigrants from Colombia by Disability Age 65 to 74
In terms of disability age 65 to 74, the demographic groups most similar to Immigrants from Colombia are Jordanian (22.2%, a difference of 0.030%), Uruguayan (22.2%, a difference of 0.13%), Immigrants from England (22.2%, a difference of 0.14%), Immigrants from Saudi Arabia (22.2%, a difference of 0.17%), and South American (22.2%, a difference of 0.19%).
| Demographics | Rating | Rank | Disability Age 65 to 74 |
| Poles | 97.8 /100 | #92 | Exceptional 22.0% |
| Immigrants | Canada | 97.8 /100 | #93 | Exceptional 22.1% |
| Immigrants | Chile | 97.7 /100 | #94 | Exceptional 22.1% |
| Romanians | 97.7 /100 | #95 | Exceptional 22.1% |
| Immigrants | North America | 97.5 /100 | #96 | Exceptional 22.1% |
| Immigrants | Southern Europe | 97.2 /100 | #97 | Exceptional 22.1% |
| Jordanians | 96.9 /100 | #98 | Exceptional 22.2% |
| Immigrants | Colombia | 96.8 /100 | #99 | Exceptional 22.2% |
| Uruguayans | 96.5 /100 | #100 | Exceptional 22.2% |
| Immigrants | England | 96.5 /100 | #101 | Exceptional 22.2% |
| Immigrants | Saudi Arabia | 96.4 /100 | #102 | Exceptional 22.2% |
| South Americans | 96.4 /100 | #103 | Exceptional 22.2% |
| Colombians | 96.4 /100 | #104 | Exceptional 22.2% |
| Palestinians | 96.3 /100 | #105 | Exceptional 22.2% |
| Peruvians | 96.1 /100 | #106 | Exceptional 22.2% |