South American vs Immigrants from Ireland Disability Age Over 75
COMPARE
South American
Immigrants from Ireland
Disability Age Over 75
Disability Age Over 75 Comparison
South Americans
Immigrants from Ireland
46.8%
DISABILITY AGE OVER 75
90.0/ 100
METRIC RATING
132nd/ 347
METRIC RANK
44.7%
DISABILITY AGE OVER 75
100.0/ 100
METRIC RATING
2nd/ 347
METRIC RANK
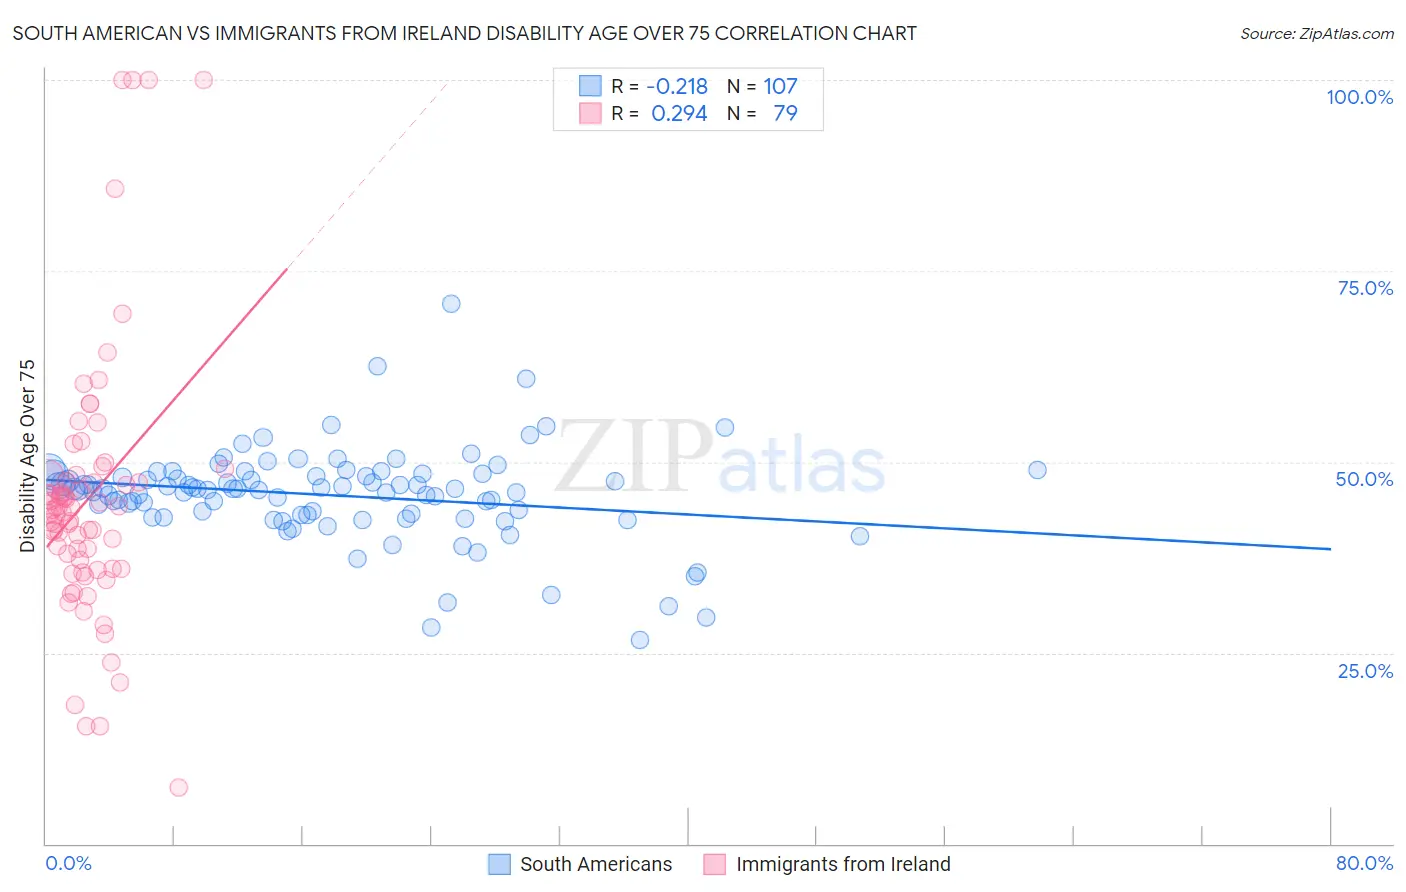
South American vs Immigrants from Ireland Disability Age Over 75 Correlation Chart
The statistical analysis conducted on geographies consisting of 492,705,968 people shows a weak negative correlation between the proportion of South Americans and percentage of population with a disability over the age of 75 in the United States with a correlation coefficient (R) of -0.218 and weighted average of 46.8%. Similarly, the statistical analysis conducted on geographies consisting of 240,669,284 people shows a weak positive correlation between the proportion of Immigrants from Ireland and percentage of population with a disability over the age of 75 in the United States with a correlation coefficient (R) of 0.294 and weighted average of 44.7%, a difference of 4.7%.
Disability Age Over 75 Correlation Summary
| Measurement | South American | Immigrants from Ireland |
| Minimum | 26.7% | 7.4% |
| Maximum | 70.7% | 100.0% |
| Range | 44.1% | 92.6% |
| Mean | 45.6% | 45.1% |
| Median | 46.4% | 43.7% |
| Interquartile 25% (IQ1) | 43.0% | 36.0% |
| Interquartile 75% (IQ3) | 48.3% | 47.9% |
| Interquartile Range (IQR) | 5.3% | 11.9% |
| Standard Deviation (Sample) | 6.2% | 17.3% |
| Standard Deviation (Population) | 6.2% | 17.2% |
Similar Demographics by Disability Age Over 75
Demographics Similar to South Americans by Disability Age Over 75
In terms of disability age over 75, the demographic groups most similar to South Americans are Scottish (46.7%, a difference of 0.030%), English (46.8%, a difference of 0.040%), Immigrants from Northern Africa (46.7%, a difference of 0.050%), Immigrants from Ethiopia (46.8%, a difference of 0.050%), and Icelander (46.7%, a difference of 0.060%).
| Demographics | Rating | Rank | Disability Age Over 75 |
| Colombians | 91.3 /100 | #125 | Exceptional 46.7% |
| Europeans | 91.2 /100 | #126 | Exceptional 46.7% |
| Syrians | 91.1 /100 | #127 | Exceptional 46.7% |
| Icelanders | 90.9 /100 | #128 | Exceptional 46.7% |
| Immigrants | Germany | 90.8 /100 | #129 | Exceptional 46.7% |
| Immigrants | Northern Africa | 90.7 /100 | #130 | Exceptional 46.7% |
| Scottish | 90.5 /100 | #131 | Exceptional 46.7% |
| South Americans | 90.0 /100 | #132 | Excellent 46.8% |
| English | 89.4 /100 | #133 | Excellent 46.8% |
| Immigrants | Ethiopia | 89.1 /100 | #134 | Excellent 46.8% |
| Ethiopians | 88.9 /100 | #135 | Excellent 46.8% |
| Immigrants | Venezuela | 88.6 /100 | #136 | Excellent 46.8% |
| Immigrants | Uganda | 88.5 /100 | #137 | Excellent 46.8% |
| Immigrants | Bosnia and Herzegovina | 88.5 /100 | #138 | Excellent 46.8% |
| Yugoslavians | 88.5 /100 | #139 | Excellent 46.8% |
Demographics Similar to Immigrants from Ireland by Disability Age Over 75
In terms of disability age over 75, the demographic groups most similar to Immigrants from Ireland are Eastern European (44.8%, a difference of 0.29%), Carpatho Rusyn (44.8%, a difference of 0.32%), Luxembourger (44.8%, a difference of 0.38%), Immigrants from Lithuania (44.9%, a difference of 0.47%), and Okinawan (44.9%, a difference of 0.51%).
| Demographics | Rating | Rank | Disability Age Over 75 |
| Cypriots | 100.0 /100 | #1 | Exceptional 43.5% |
| Immigrants | Ireland | 100.0 /100 | #2 | Exceptional 44.7% |
| Eastern Europeans | 100.0 /100 | #3 | Exceptional 44.8% |
| Carpatho Rusyns | 100.0 /100 | #4 | Exceptional 44.8% |
| Luxembourgers | 100.0 /100 | #5 | Exceptional 44.8% |
| Immigrants | Lithuania | 100.0 /100 | #6 | Exceptional 44.9% |
| Okinawans | 100.0 /100 | #7 | Exceptional 44.9% |
| Immigrants | Austria | 100.0 /100 | #8 | Exceptional 44.9% |
| Paraguayans | 100.0 /100 | #9 | Exceptional 45.0% |
| Bulgarians | 100.0 /100 | #10 | Exceptional 45.1% |
| Lithuanians | 100.0 /100 | #11 | Exceptional 45.1% |
| Immigrants | Czechoslovakia | 100.0 /100 | #12 | Exceptional 45.1% |
| Latvians | 100.0 /100 | #13 | Exceptional 45.1% |
| Immigrants | Scotland | 100.0 /100 | #14 | Exceptional 45.1% |
| Immigrants | Sweden | 100.0 /100 | #15 | Exceptional 45.1% |