Immigrants from Turkey vs Immigrants from Ireland Disability Age Over 75
COMPARE
Immigrants from Turkey
Immigrants from Ireland
Disability Age Over 75
Disability Age Over 75 Comparison
Immigrants from Turkey
Immigrants from Ireland
45.9%
DISABILITY AGE OVER 75
99.6/ 100
METRIC RATING
57th/ 347
METRIC RANK
44.7%
DISABILITY AGE OVER 75
100.0/ 100
METRIC RATING
2nd/ 347
METRIC RANK
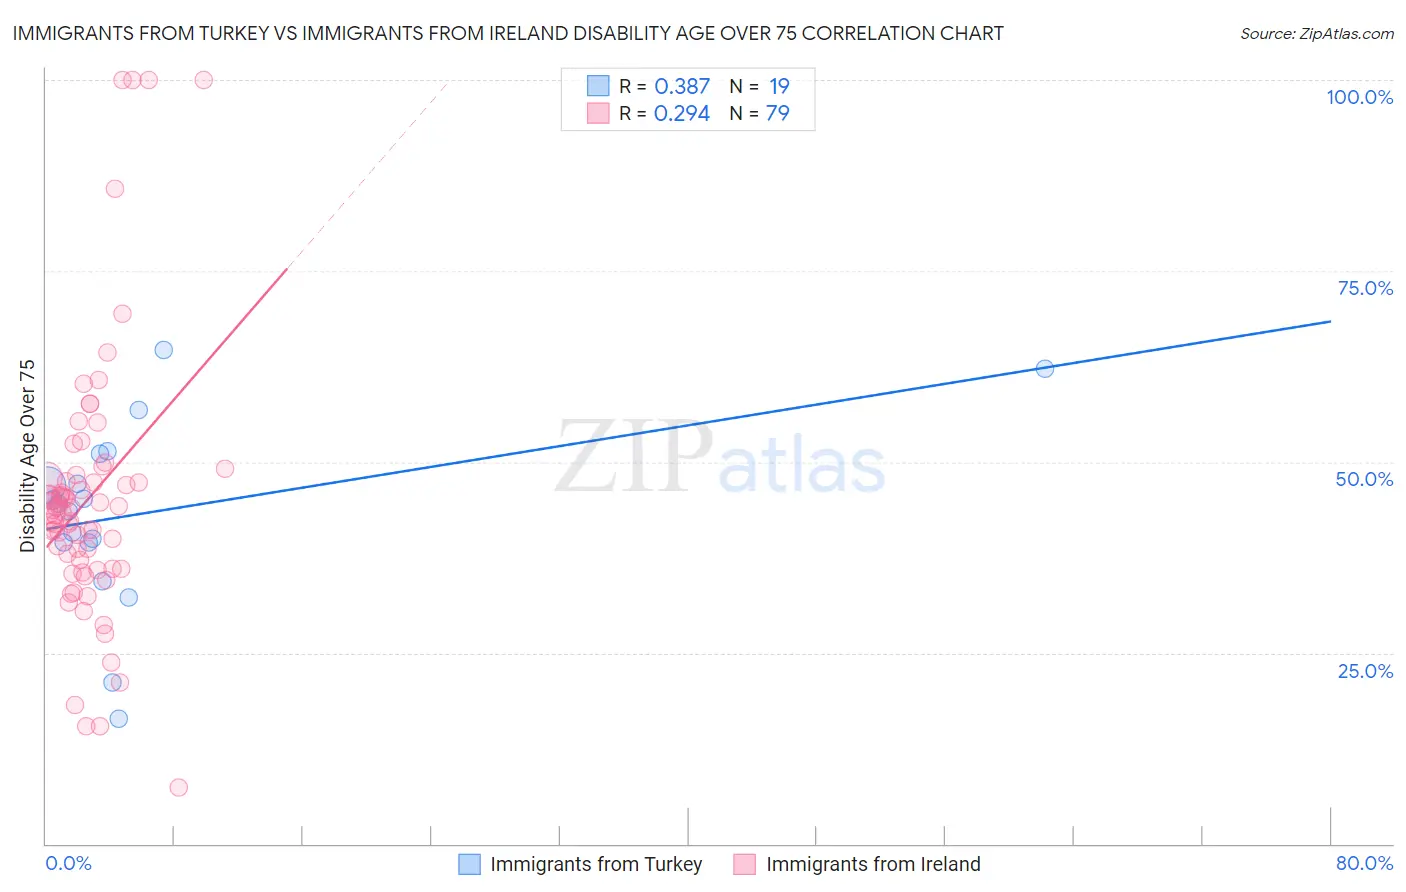
Immigrants from Turkey vs Immigrants from Ireland Disability Age Over 75 Correlation Chart
The statistical analysis conducted on geographies consisting of 222,857,012 people shows a mild positive correlation between the proportion of Immigrants from Turkey and percentage of population with a disability over the age of 75 in the United States with a correlation coefficient (R) of 0.387 and weighted average of 45.9%. Similarly, the statistical analysis conducted on geographies consisting of 240,669,284 people shows a weak positive correlation between the proportion of Immigrants from Ireland and percentage of population with a disability over the age of 75 in the United States with a correlation coefficient (R) of 0.294 and weighted average of 44.7%, a difference of 2.7%.
Disability Age Over 75 Correlation Summary
| Measurement | Immigrants from Turkey | Immigrants from Ireland |
| Minimum | 16.4% | 7.4% |
| Maximum | 64.6% | 100.0% |
| Range | 48.1% | 92.6% |
| Mean | 43.3% | 45.1% |
| Median | 44.5% | 43.7% |
| Interquartile 25% (IQ1) | 39.4% | 36.0% |
| Interquartile 75% (IQ3) | 51.0% | 47.9% |
| Interquartile Range (IQR) | 11.6% | 11.9% |
| Standard Deviation (Sample) | 12.1% | 17.3% |
| Standard Deviation (Population) | 11.7% | 17.2% |
Similar Demographics by Disability Age Over 75
Demographics Similar to Immigrants from Turkey by Disability Age Over 75
In terms of disability age over 75, the demographic groups most similar to Immigrants from Turkey are Immigrants from Israel (45.9%, a difference of 0.0%), Immigrants from Netherlands (45.9%, a difference of 0.010%), Iranian (45.9%, a difference of 0.010%), Immigrants from Europe (45.9%, a difference of 0.010%), and Immigrants from Argentina (45.9%, a difference of 0.040%).
| Demographics | Rating | Rank | Disability Age Over 75 |
| Belgians | 99.7 /100 | #50 | Exceptional 45.8% |
| Immigrants | Korea | 99.7 /100 | #51 | Exceptional 45.8% |
| Immigrants | France | 99.7 /100 | #52 | Exceptional 45.8% |
| Immigrants | Italy | 99.7 /100 | #53 | Exceptional 45.8% |
| Slovaks | 99.6 /100 | #54 | Exceptional 45.8% |
| Maltese | 99.6 /100 | #55 | Exceptional 45.8% |
| Immigrants | Netherlands | 99.6 /100 | #56 | Exceptional 45.9% |
| Immigrants | Turkey | 99.6 /100 | #57 | Exceptional 45.9% |
| Immigrants | Israel | 99.6 /100 | #58 | Exceptional 45.9% |
| Iranians | 99.6 /100 | #59 | Exceptional 45.9% |
| Immigrants | Europe | 99.6 /100 | #60 | Exceptional 45.9% |
| Immigrants | Argentina | 99.6 /100 | #61 | Exceptional 45.9% |
| Burmese | 99.5 /100 | #62 | Exceptional 45.9% |
| Immigrants | Norway | 99.5 /100 | #63 | Exceptional 45.9% |
| Immigrants | North Macedonia | 99.5 /100 | #64 | Exceptional 45.9% |
Demographics Similar to Immigrants from Ireland by Disability Age Over 75
In terms of disability age over 75, the demographic groups most similar to Immigrants from Ireland are Eastern European (44.8%, a difference of 0.29%), Carpatho Rusyn (44.8%, a difference of 0.32%), Luxembourger (44.8%, a difference of 0.38%), Immigrants from Lithuania (44.9%, a difference of 0.47%), and Okinawan (44.9%, a difference of 0.51%).
| Demographics | Rating | Rank | Disability Age Over 75 |
| Cypriots | 100.0 /100 | #1 | Exceptional 43.5% |
| Immigrants | Ireland | 100.0 /100 | #2 | Exceptional 44.7% |
| Eastern Europeans | 100.0 /100 | #3 | Exceptional 44.8% |
| Carpatho Rusyns | 100.0 /100 | #4 | Exceptional 44.8% |
| Luxembourgers | 100.0 /100 | #5 | Exceptional 44.8% |
| Immigrants | Lithuania | 100.0 /100 | #6 | Exceptional 44.9% |
| Okinawans | 100.0 /100 | #7 | Exceptional 44.9% |
| Immigrants | Austria | 100.0 /100 | #8 | Exceptional 44.9% |
| Paraguayans | 100.0 /100 | #9 | Exceptional 45.0% |
| Bulgarians | 100.0 /100 | #10 | Exceptional 45.1% |
| Lithuanians | 100.0 /100 | #11 | Exceptional 45.1% |
| Immigrants | Czechoslovakia | 100.0 /100 | #12 | Exceptional 45.1% |
| Latvians | 100.0 /100 | #13 | Exceptional 45.1% |
| Immigrants | Scotland | 100.0 /100 | #14 | Exceptional 45.1% |
| Immigrants | Sweden | 100.0 /100 | #15 | Exceptional 45.1% |