Slovene vs Immigrants from Liberia Disability Age 18 to 34
COMPARE
Slovene
Immigrants from Liberia
Disability Age 18 to 34
Disability Age 18 to 34 Comparison
Slovenes
Immigrants from Liberia
7.3%
DISABILITY AGE 18 TO 34
0.1/ 100
METRIC RATING
265th/ 347
METRIC RANK
7.1%
DISABILITY AGE 18 TO 34
0.8/ 100
METRIC RATING
246th/ 347
METRIC RANK
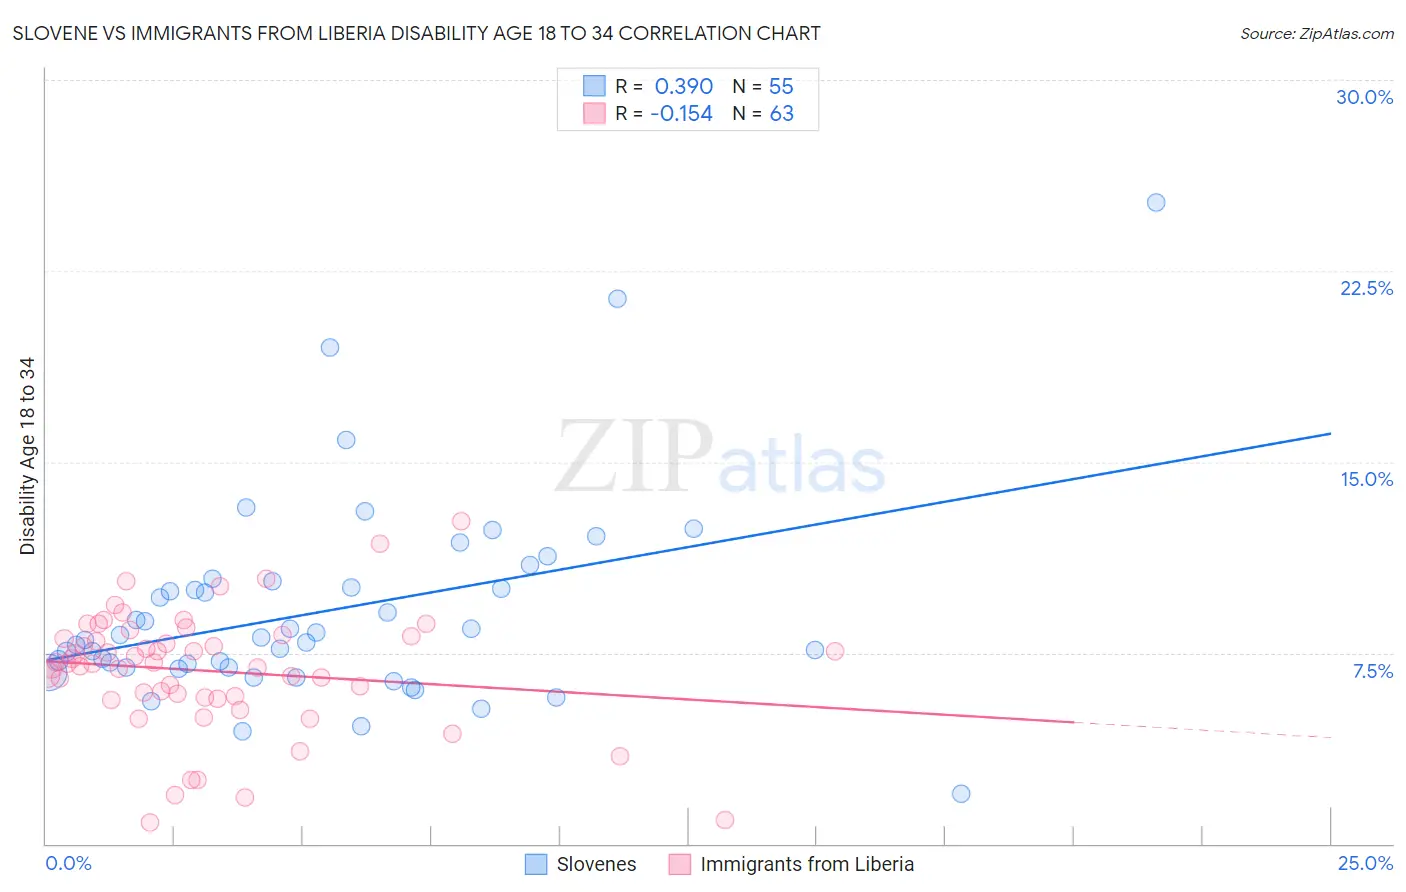
Slovene vs Immigrants from Liberia Disability Age 18 to 34 Correlation Chart
The statistical analysis conducted on geographies consisting of 260,842,268 people shows a mild positive correlation between the proportion of Slovenes and percentage of population with a disability between the ages 18 and 35 in the United States with a correlation coefficient (R) of 0.390 and weighted average of 7.3%. Similarly, the statistical analysis conducted on geographies consisting of 135,213,913 people shows a poor negative correlation between the proportion of Immigrants from Liberia and percentage of population with a disability between the ages 18 and 35 in the United States with a correlation coefficient (R) of -0.154 and weighted average of 7.1%, a difference of 2.9%.
Disability Age 18 to 34 Correlation Summary
| Measurement | Slovene | Immigrants from Liberia |
| Minimum | 2.0% | 0.85% |
| Maximum | 25.2% | 12.7% |
| Range | 23.2% | 11.8% |
| Mean | 9.2% | 6.8% |
| Median | 8.1% | 7.1% |
| Interquartile 25% (IQ1) | 6.9% | 5.7% |
| Interquartile 75% (IQ3) | 10.3% | 8.2% |
| Interquartile Range (IQR) | 3.4% | 2.4% |
| Standard Deviation (Sample) | 4.0% | 2.4% |
| Standard Deviation (Population) | 4.0% | 2.4% |
Demographics Similar to Slovenes and Immigrants from Liberia by Disability Age 18 to 34
In terms of disability age 18 to 34, the demographic groups most similar to Slovenes are Bermudan (7.3%, a difference of 0.020%), British (7.3%, a difference of 0.28%), Canadian (7.3%, a difference of 0.57%), Northern European (7.3%, a difference of 0.60%), and Tohono O'odham (7.3%, a difference of 0.77%). Similarly, the demographic groups most similar to Immigrants from Liberia are Hungarian (7.1%, a difference of 0.020%), Yugoslavian (7.2%, a difference of 0.15%), Guamanian/Chamorro (7.2%, a difference of 0.18%), Malaysian (7.2%, a difference of 0.28%), and Fijian (7.2%, a difference of 0.58%).
| Demographics | Rating | Rank | Disability Age 18 to 34 |
| Hungarians | 0.9 /100 | #245 | Tragic 7.1% |
| Immigrants | Liberia | 0.8 /100 | #246 | Tragic 7.1% |
| Yugoslavians | 0.8 /100 | #247 | Tragic 7.2% |
| Guamanians/Chamorros | 0.8 /100 | #248 | Tragic 7.2% |
| Malaysians | 0.7 /100 | #249 | Tragic 7.2% |
| Fijians | 0.6 /100 | #250 | Tragic 7.2% |
| Spaniards | 0.6 /100 | #251 | Tragic 7.2% |
| Poles | 0.6 /100 | #252 | Tragic 7.2% |
| Croatians | 0.5 /100 | #253 | Tragic 7.2% |
| Indonesians | 0.4 /100 | #254 | Tragic 7.2% |
| Immigrants | Germany | 0.4 /100 | #255 | Tragic 7.2% |
| Immigrants | Laos | 0.4 /100 | #256 | Tragic 7.2% |
| Czechs | 0.3 /100 | #257 | Tragic 7.2% |
| Immigrants | Micronesia | 0.3 /100 | #258 | Tragic 7.3% |
| Somalis | 0.2 /100 | #259 | Tragic 7.3% |
| Tohono O'odham | 0.2 /100 | #260 | Tragic 7.3% |
| Northern Europeans | 0.2 /100 | #261 | Tragic 7.3% |
| Canadians | 0.2 /100 | #262 | Tragic 7.3% |
| British | 0.2 /100 | #263 | Tragic 7.3% |
| Bermudans | 0.1 /100 | #264 | Tragic 7.3% |
| Slovenes | 0.1 /100 | #265 | Tragic 7.3% |