Ugandan vs Immigrants from Liberia Disability Age 18 to 34
COMPARE
Ugandan
Immigrants from Liberia
Disability Age 18 to 34
Disability Age 18 to 34 Comparison
Ugandans
Immigrants from Liberia
6.9%
DISABILITY AGE 18 TO 34
4.4/ 100
METRIC RATING
226th/ 347
METRIC RANK
7.1%
DISABILITY AGE 18 TO 34
0.8/ 100
METRIC RATING
246th/ 347
METRIC RANK
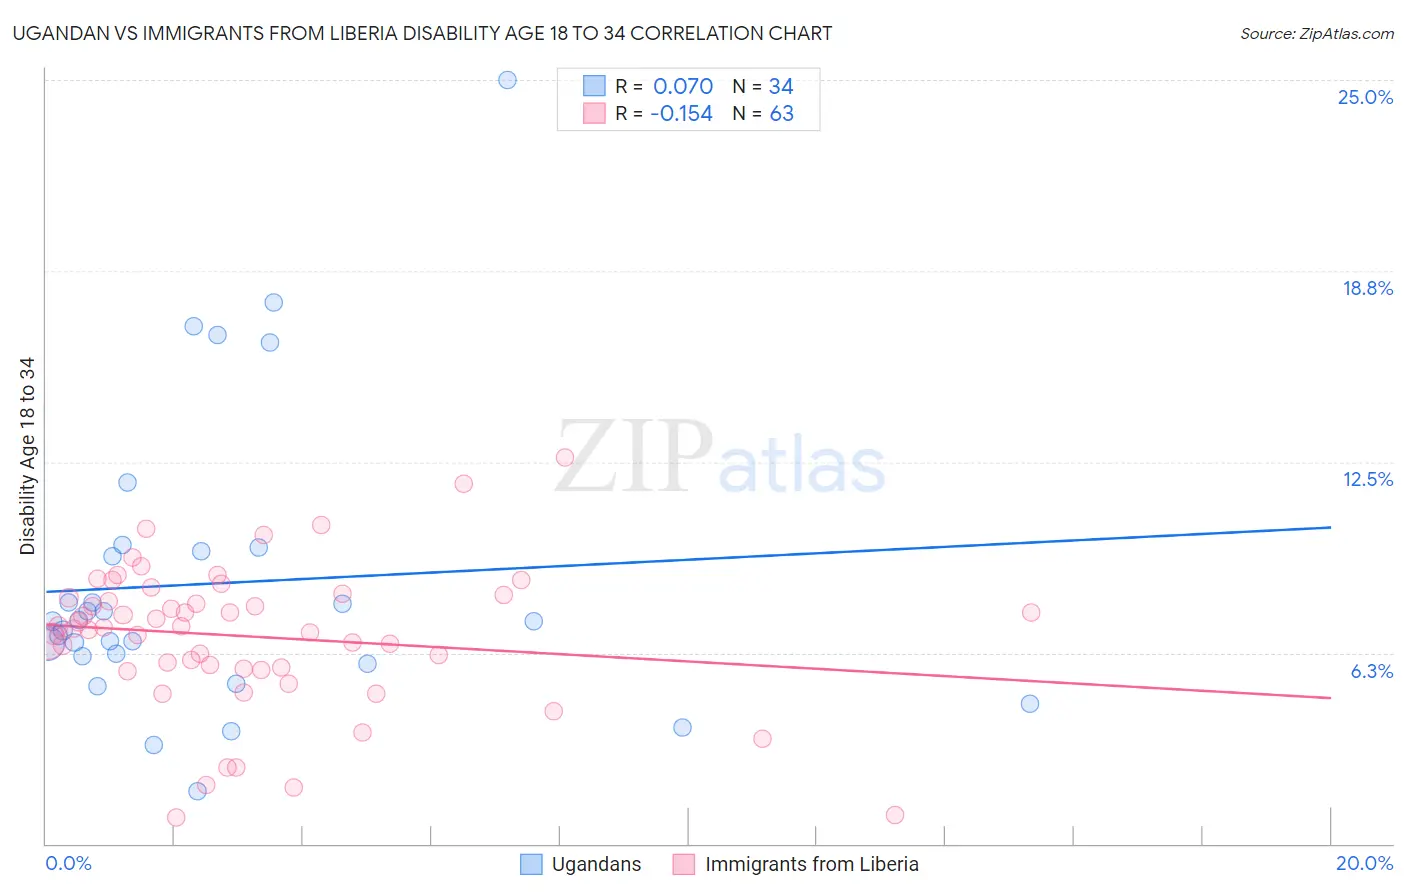
Ugandan vs Immigrants from Liberia Disability Age 18 to 34 Correlation Chart
The statistical analysis conducted on geographies consisting of 93,970,898 people shows a slight positive correlation between the proportion of Ugandans and percentage of population with a disability between the ages 18 and 35 in the United States with a correlation coefficient (R) of 0.070 and weighted average of 6.9%. Similarly, the statistical analysis conducted on geographies consisting of 135,213,913 people shows a poor negative correlation between the proportion of Immigrants from Liberia and percentage of population with a disability between the ages 18 and 35 in the United States with a correlation coefficient (R) of -0.154 and weighted average of 7.1%, a difference of 2.8%.
Disability Age 18 to 34 Correlation Summary
| Measurement | Ugandan | Immigrants from Liberia |
| Minimum | 1.7% | 0.85% |
| Maximum | 25.0% | 12.7% |
| Range | 23.3% | 11.8% |
| Mean | 8.5% | 6.8% |
| Median | 7.3% | 7.1% |
| Interquartile 25% (IQ1) | 6.1% | 5.7% |
| Interquartile 75% (IQ3) | 9.6% | 8.2% |
| Interquartile Range (IQR) | 3.4% | 2.4% |
| Standard Deviation (Sample) | 4.8% | 2.4% |
| Standard Deviation (Population) | 4.8% | 2.4% |
Demographics Similar to Ugandans and Immigrants from Liberia by Disability Age 18 to 34
In terms of disability age 18 to 34, the demographic groups most similar to Ugandans are Immigrants from Canada (7.0%, a difference of 0.050%), Immigrants from Yemen (7.0%, a difference of 0.10%), Lithuanian (7.0%, a difference of 0.13%), Immigrants from North America (7.0%, a difference of 0.22%), and Ute (7.0%, a difference of 0.25%). Similarly, the demographic groups most similar to Immigrants from Liberia are Hungarian (7.1%, a difference of 0.020%), Immigrants from Zaire (7.1%, a difference of 0.12%), Icelander (7.1%, a difference of 0.33%), Immigrants from Congo (7.1%, a difference of 0.39%), and Nepalese (7.1%, a difference of 0.43%).
| Demographics | Rating | Rank | Disability Age 18 to 34 |
| Ugandans | 4.4 /100 | #226 | Tragic 6.9% |
| Immigrants | Canada | 4.3 /100 | #227 | Tragic 7.0% |
| Immigrants | Yemen | 4.2 /100 | #228 | Tragic 7.0% |
| Lithuanians | 4.1 /100 | #229 | Tragic 7.0% |
| Immigrants | North America | 3.9 /100 | #230 | Tragic 7.0% |
| Ute | 3.8 /100 | #231 | Tragic 7.0% |
| Samoans | 3.2 /100 | #232 | Tragic 7.0% |
| New Zealanders | 2.7 /100 | #233 | Tragic 7.0% |
| Alsatians | 2.1 /100 | #234 | Tragic 7.0% |
| Sub-Saharan Africans | 1.7 /100 | #235 | Tragic 7.1% |
| Liberians | 1.5 /100 | #236 | Tragic 7.1% |
| Austrians | 1.3 /100 | #237 | Tragic 7.1% |
| Marshallese | 1.3 /100 | #238 | Tragic 7.1% |
| Italians | 1.2 /100 | #239 | Tragic 7.1% |
| Arapaho | 1.1 /100 | #240 | Tragic 7.1% |
| Nepalese | 1.1 /100 | #241 | Tragic 7.1% |
| Immigrants | Congo | 1.1 /100 | #242 | Tragic 7.1% |
| Icelanders | 1.0 /100 | #243 | Tragic 7.1% |
| Immigrants | Zaire | 0.9 /100 | #244 | Tragic 7.1% |
| Hungarians | 0.9 /100 | #245 | Tragic 7.1% |
| Immigrants | Liberia | 0.8 /100 | #246 | Tragic 7.1% |