Slovak vs Yuman Disability Age 18 to 34
COMPARE
Slovak
Yuman
Disability Age 18 to 34
Disability Age 18 to 34 Comparison
Slovaks
Yuman
7.7%
DISABILITY AGE 18 TO 34
0.0/ 100
METRIC RATING
290th/ 347
METRIC RANK
10.6%
DISABILITY AGE 18 TO 34
0.0/ 100
METRIC RATING
347th/ 347
METRIC RANK
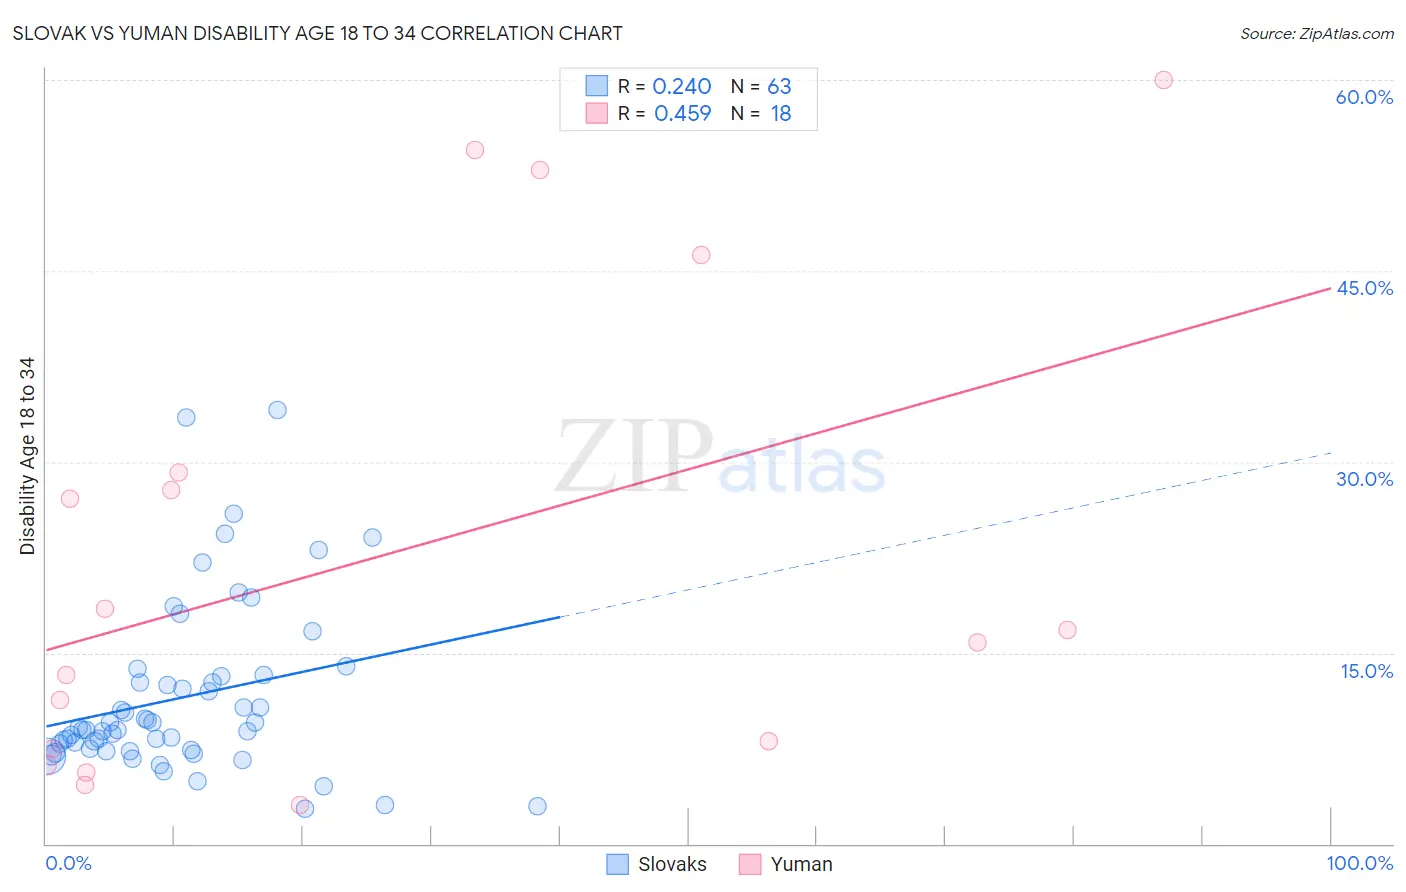
Slovak vs Yuman Disability Age 18 to 34 Correlation Chart
The statistical analysis conducted on geographies consisting of 396,424,905 people shows a weak positive correlation between the proportion of Slovaks and percentage of population with a disability between the ages 18 and 35 in the United States with a correlation coefficient (R) of 0.240 and weighted average of 7.7%. Similarly, the statistical analysis conducted on geographies consisting of 40,657,868 people shows a moderate positive correlation between the proportion of Yuman and percentage of population with a disability between the ages 18 and 35 in the United States with a correlation coefficient (R) of 0.459 and weighted average of 10.6%, a difference of 37.9%.
Disability Age 18 to 34 Correlation Summary
| Measurement | Slovak | Yuman |
| Minimum | 2.8% | 3.0% |
| Maximum | 34.1% | 60.0% |
| Range | 31.4% | 57.0% |
| Mean | 11.5% | 22.7% |
| Median | 9.0% | 16.3% |
| Interquartile 25% (IQ1) | 7.3% | 7.4% |
| Interquartile 75% (IQ3) | 13.2% | 29.2% |
| Interquartile Range (IQR) | 5.8% | 21.8% |
| Standard Deviation (Sample) | 6.7% | 18.8% |
| Standard Deviation (Population) | 6.6% | 18.3% |
Similar Demographics by Disability Age 18 to 34
Demographics Similar to Slovaks by Disability Age 18 to 34
In terms of disability age 18 to 34, the demographic groups most similar to Slovaks are Irish (7.7%, a difference of 0.040%), Nonimmigrants (7.6%, a difference of 0.090%), White/Caucasian (7.6%, a difference of 0.21%), Black/African American (7.7%, a difference of 0.27%), and Norwegian (7.6%, a difference of 0.31%).
| Demographics | Rating | Rank | Disability Age 18 to 34 |
| Danes | 0.0 /100 | #283 | Tragic 7.5% |
| Hopi | 0.0 /100 | #284 | Tragic 7.5% |
| Swedes | 0.0 /100 | #285 | Tragic 7.5% |
| Celtics | 0.0 /100 | #286 | Tragic 7.6% |
| Norwegians | 0.0 /100 | #287 | Tragic 7.6% |
| Whites/Caucasians | 0.0 /100 | #288 | Tragic 7.6% |
| Immigrants | Nonimmigrants | 0.0 /100 | #289 | Tragic 7.6% |
| Slovaks | 0.0 /100 | #290 | Tragic 7.7% |
| Irish | 0.0 /100 | #291 | Tragic 7.7% |
| Blacks/African Americans | 0.0 /100 | #292 | Tragic 7.7% |
| Scandinavians | 0.0 /100 | #293 | Tragic 7.7% |
| Immigrants | Cabo Verde | 0.0 /100 | #294 | Tragic 7.7% |
| Tlingit-Haida | 0.0 /100 | #295 | Tragic 7.7% |
| Cape Verdeans | 0.0 /100 | #296 | Tragic 7.7% |
| Pueblo | 0.0 /100 | #297 | Tragic 7.7% |
Demographics Similar to Yuman by Disability Age 18 to 34
In terms of disability age 18 to 34, the demographic groups most similar to Yuman are Houma (9.7%, a difference of 8.9%), Alaskan Athabascan (9.4%, a difference of 11.8%), Creek (9.0%, a difference of 17.1%), Chippewa (9.0%, a difference of 17.6%), and Yakama (9.0%, a difference of 17.6%).
| Demographics | Rating | Rank | Disability Age 18 to 34 |
| Apache | 0.0 /100 | #333 | Tragic 8.4% |
| Dutch West Indians | 0.0 /100 | #334 | Tragic 8.4% |
| Seminole | 0.0 /100 | #335 | Tragic 8.4% |
| Immigrants | Azores | 0.0 /100 | #336 | Tragic 8.5% |
| Ottawa | 0.0 /100 | #337 | Tragic 8.6% |
| Cherokee | 0.0 /100 | #338 | Tragic 8.7% |
| Kiowa | 0.0 /100 | #339 | Tragic 8.8% |
| Choctaw | 0.0 /100 | #340 | Tragic 9.0% |
| Chickasaw | 0.0 /100 | #341 | Tragic 9.0% |
| Yakama | 0.0 /100 | #342 | Tragic 9.0% |
| Chippewa | 0.0 /100 | #343 | Tragic 9.0% |
| Creek | 0.0 /100 | #344 | Tragic 9.0% |
| Alaskan Athabascans | 0.0 /100 | #345 | Tragic 9.4% |
| Houma | 0.0 /100 | #346 | Tragic 9.7% |
| Yuman | 0.0 /100 | #347 | Tragic 10.6% |