Scottish vs Shoshone Disability Age 18 to 34
COMPARE
Scottish
Shoshone
Disability Age 18 to 34
Disability Age 18 to 34 Comparison
Scottish
Shoshone
7.7%
DISABILITY AGE 18 TO 34
0.0/ 100
METRIC RATING
300th/ 347
METRIC RANK
7.8%
DISABILITY AGE 18 TO 34
0.0/ 100
METRIC RATING
304th/ 347
METRIC RANK
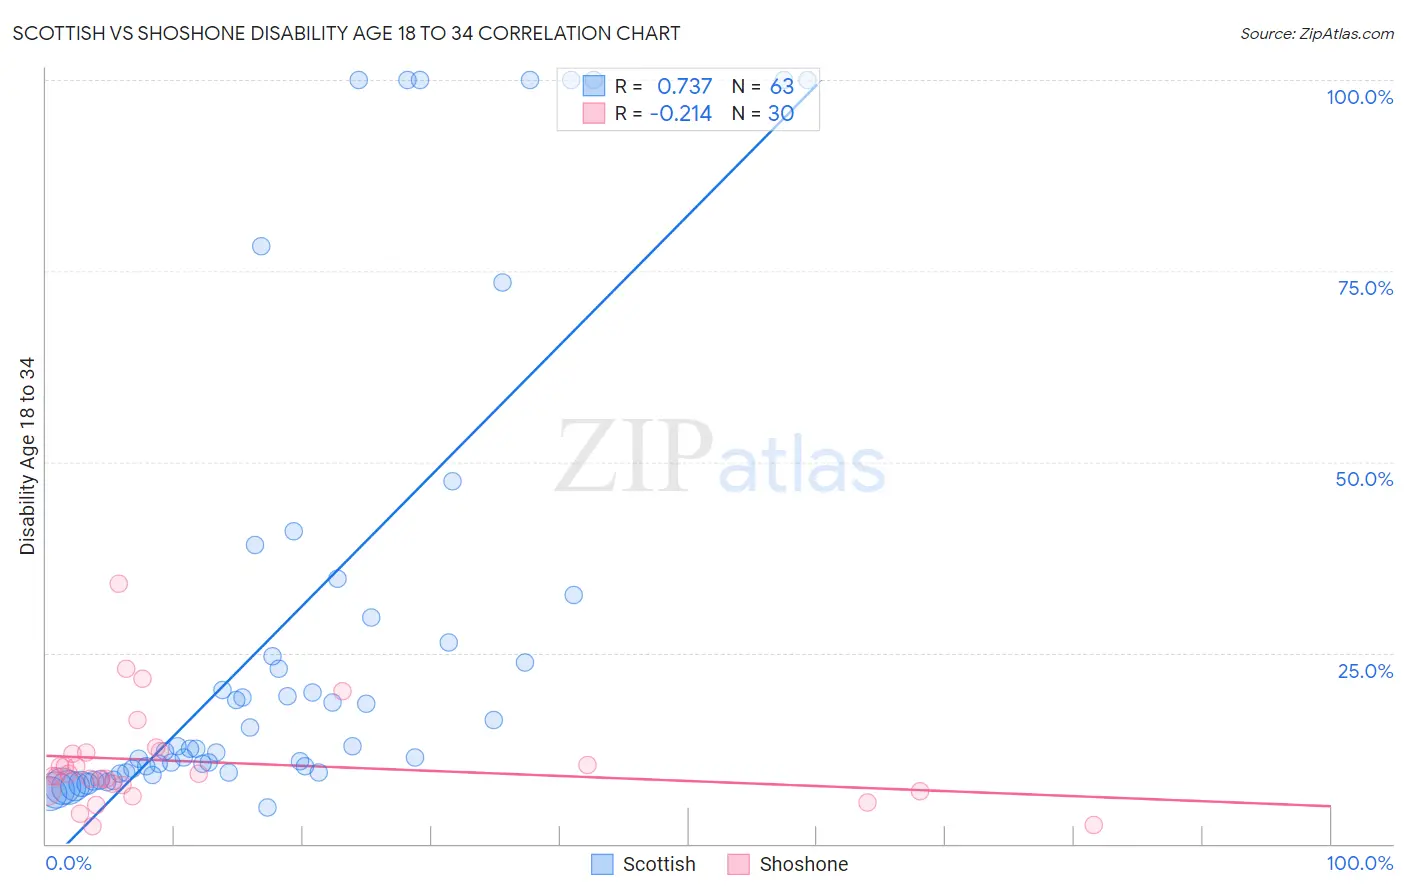
Scottish vs Shoshone Disability Age 18 to 34 Correlation Chart
The statistical analysis conducted on geographies consisting of 561,209,610 people shows a strong positive correlation between the proportion of Scottish and percentage of population with a disability between the ages 18 and 35 in the United States with a correlation coefficient (R) of 0.737 and weighted average of 7.7%. Similarly, the statistical analysis conducted on geographies consisting of 66,530,861 people shows a weak negative correlation between the proportion of Shoshone and percentage of population with a disability between the ages 18 and 35 in the United States with a correlation coefficient (R) of -0.214 and weighted average of 7.8%, a difference of 0.54%.
Disability Age 18 to 34 Correlation Summary
| Measurement | Scottish | Shoshone |
| Minimum | 4.8% | 2.3% |
| Maximum | 100.0% | 34.1% |
| Range | 95.2% | 31.8% |
| Mean | 28.0% | 10.7% |
| Median | 12.5% | 9.0% |
| Interquartile 25% (IQ1) | 9.3% | 6.9% |
| Interquartile 75% (IQ3) | 29.6% | 11.9% |
| Interquartile Range (IQR) | 20.3% | 5.1% |
| Standard Deviation (Sample) | 30.9% | 6.6% |
| Standard Deviation (Population) | 30.7% | 6.5% |
Demographics Similar to Scottish and Shoshone by Disability Age 18 to 34
In terms of disability age 18 to 34, the demographic groups most similar to Scottish are German (7.7%, a difference of 0.010%), Pima (7.7%, a difference of 0.060%), Welsh (7.7%, a difference of 0.14%), Cheyenne (7.7%, a difference of 0.20%), and Dutch (7.7%, a difference of 0.25%). Similarly, the demographic groups most similar to Shoshone are Menominee (7.8%, a difference of 0.080%), English (7.8%, a difference of 0.16%), Cheyenne (7.7%, a difference of 0.34%), Welsh (7.7%, a difference of 0.41%), and Scotch-Irish (7.8%, a difference of 0.42%).
| Demographics | Rating | Rank | Disability Age 18 to 34 |
| Blacks/African Americans | 0.0 /100 | #292 | Tragic 7.7% |
| Scandinavians | 0.0 /100 | #293 | Tragic 7.7% |
| Immigrants | Cabo Verde | 0.0 /100 | #294 | Tragic 7.7% |
| Tlingit-Haida | 0.0 /100 | #295 | Tragic 7.7% |
| Cape Verdeans | 0.0 /100 | #296 | Tragic 7.7% |
| Pueblo | 0.0 /100 | #297 | Tragic 7.7% |
| Dutch | 0.0 /100 | #298 | Tragic 7.7% |
| Germans | 0.0 /100 | #299 | Tragic 7.7% |
| Scottish | 0.0 /100 | #300 | Tragic 7.7% |
| Pima | 0.0 /100 | #301 | Tragic 7.7% |
| Welsh | 0.0 /100 | #302 | Tragic 7.7% |
| Cheyenne | 0.0 /100 | #303 | Tragic 7.7% |
| Shoshone | 0.0 /100 | #304 | Tragic 7.8% |
| Menominee | 0.0 /100 | #305 | Tragic 7.8% |
| English | 0.0 /100 | #306 | Tragic 7.8% |
| Scotch-Irish | 0.0 /100 | #307 | Tragic 7.8% |
| Pennsylvania Germans | 0.0 /100 | #308 | Tragic 7.8% |
| Alaska Natives | 0.0 /100 | #309 | Tragic 7.8% |
| Finns | 0.0 /100 | #310 | Tragic 7.8% |
| French | 0.0 /100 | #311 | Tragic 7.9% |
| Spanish Americans | 0.0 /100 | #312 | Tragic 7.9% |